Documentation
How to use Nucleaus Pro
Nucleaus Pro is the complete Data & AI market intelligence system: every active solution in the market, organized into one structure you can explore, score, compare, save, and present.
Quick start#
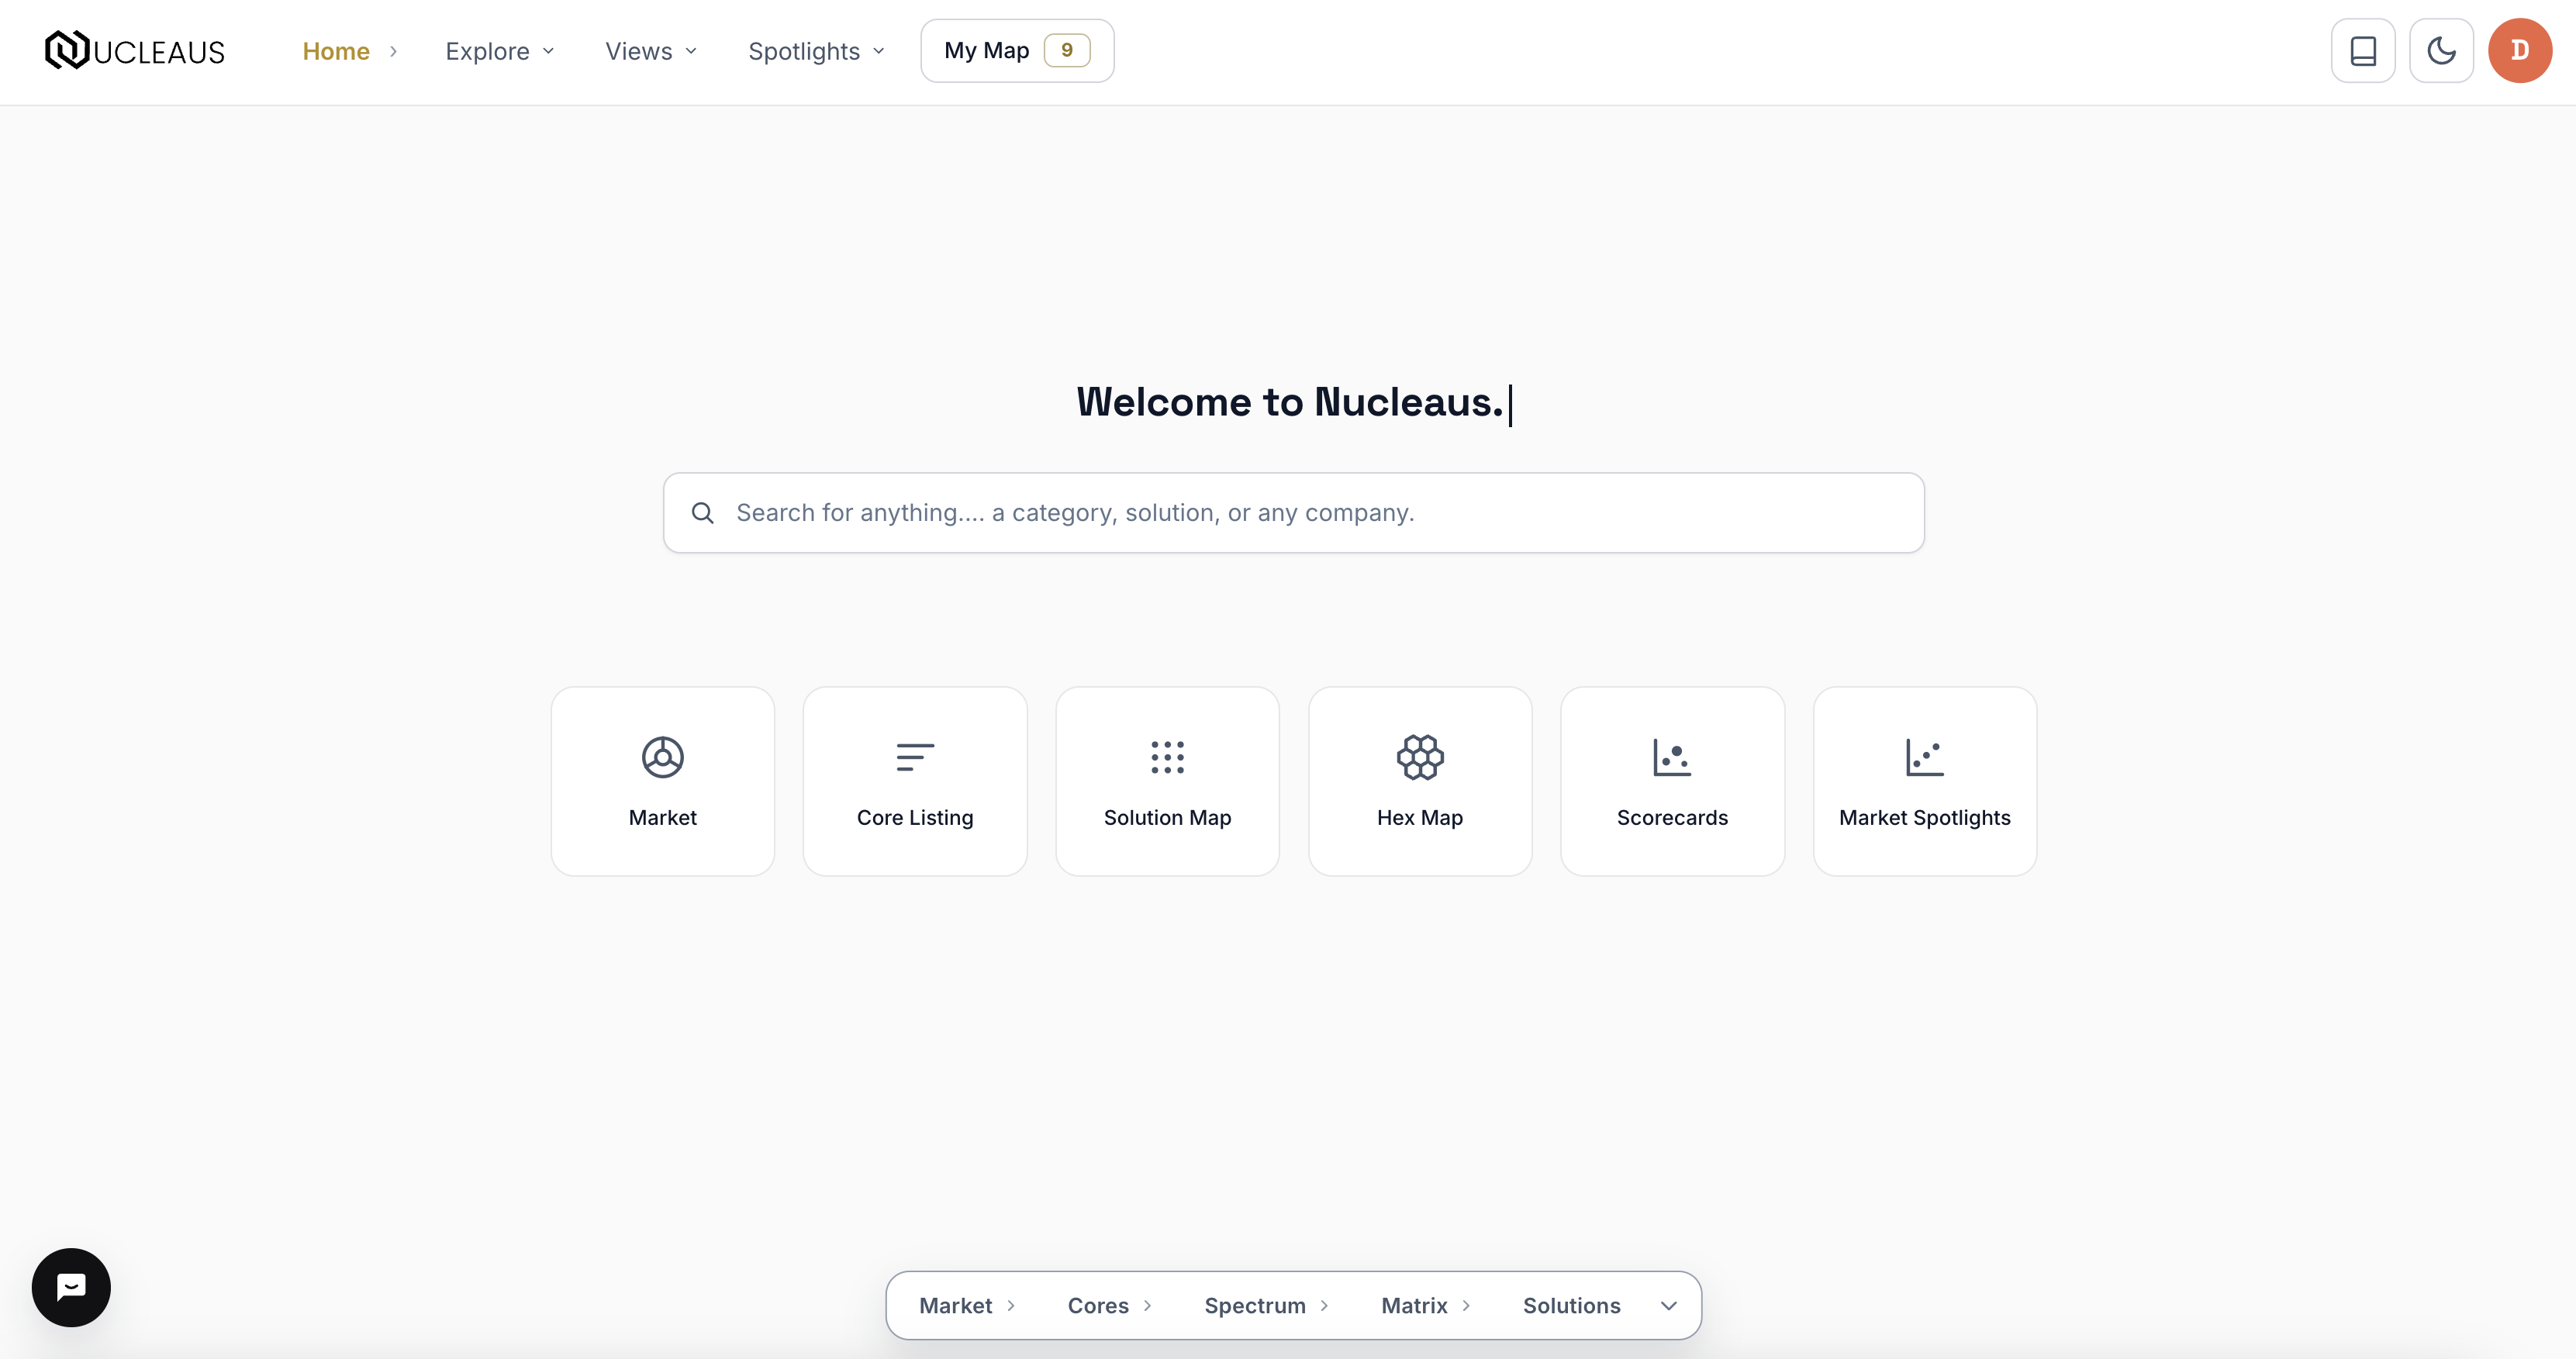
- Search from Home. Type into the SmartSearch bar on the Home page - a company, a category, or a topic - and the strongest matches appear as you type, each one a link straight to its page.
- See the whole market. Open Market for the one-wheel view of the entire catalog: three cores inside, nine spectrums outside. Click any wedge to start drilling.
- Drill to a matrix. Go Cores › Spectrum › Matrix. A matrix page lists its full roster and carries its own scorecard tab.
- Open a full profile. Click any solution to open its rail, then View full profile: description, funding, key individuals, status chips, scores, and the capability breakdown.
- Build your board. Star the solutions that matter to you. They gather in My Map, grouped by where they live, ready to export as PNG, PowerPoint, or CSV solution cards.
QuickView#
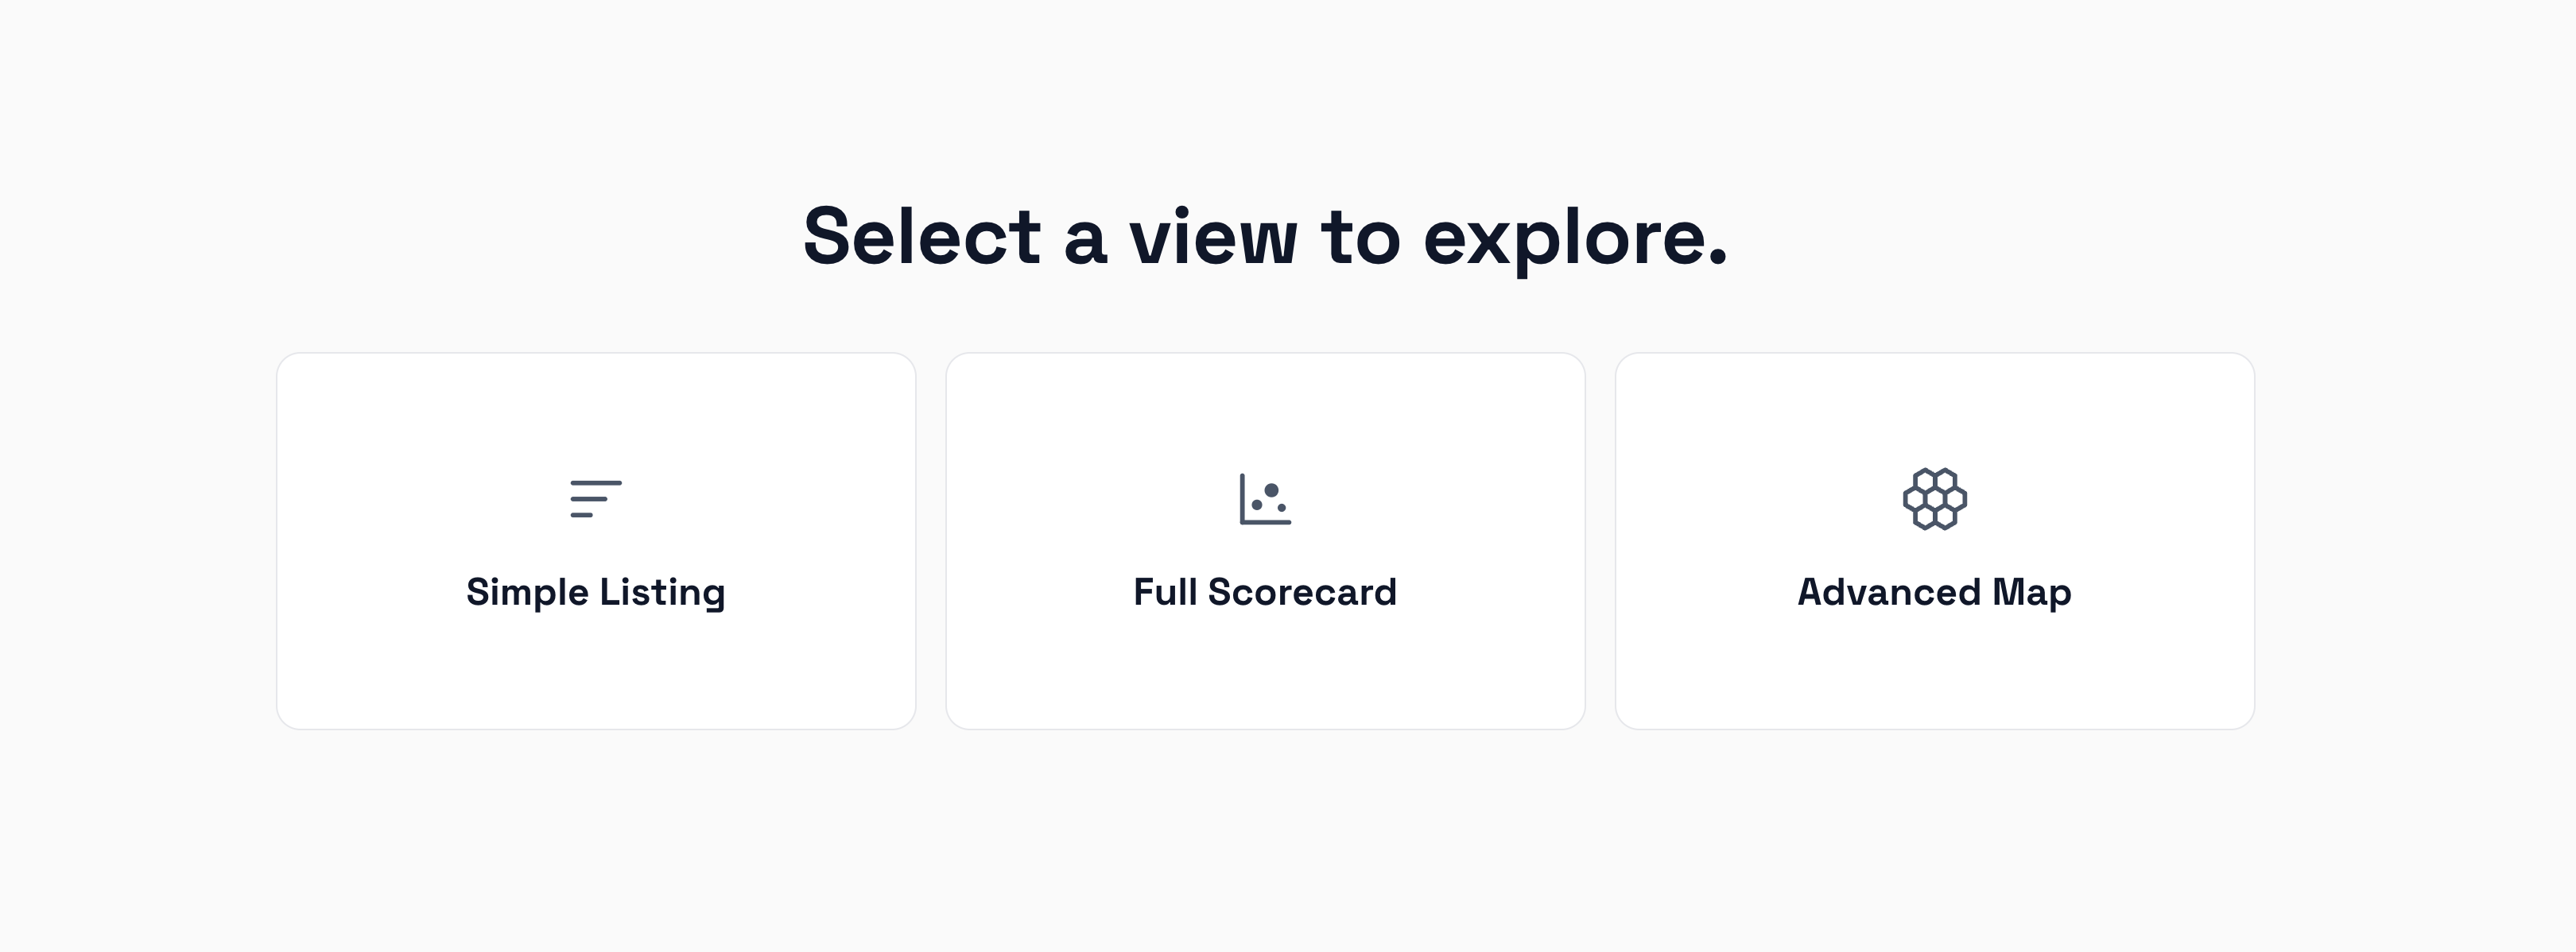
QuickView is the fastest way into the catalog: pick a view - Simple Listing, Full Scorecard, or Advanced Map - then a Core, a Spectrum, and a Matrix. The last pick launches you straight into that view, already focused on the category you chose. Open it anytime from Views › QuickView in the header.
The ontology#
Everything in Nucleaus hangs off one structure, the market ontology. Learn these four words and every screen in the product reads instantly:
Each core carries a consistent identity color everywhere in the app, so you can read a chart, a map region, or a chip at a glance. A solution belongs to exactly one matrix, one spectrum, one core - there is no double counting, and the numbers you see on different pages reconcile.
Finding your way#
The header is the same on every page and carries five things:
- Home - the landing page with global search and shortcut cards.
- Explore - the ontology levels: Market, Cores, Spectrum, Matrix, Solutions.
- Views - QuickView, then the three solution views: Scorecards, Map, and Hex.
- Spotlights - the two editorial tracks, Market Trends and Market Vertical.
- My Map - your saved board, with a live count of your stars.

The ontology navigator
A floating navigator sits at the bottom of most pages: Market › Cores › Spectrum › Matrix › Solutions. It is a live you-are-here: the current level is highlighted, the names of your current core, spectrum, matrix, or solution appear under their level words, and counts show what is available one level down. Every cell is clickable, and the chevron at its right minimizes it to a small pill (the app remembers your choice).

Every view is a link
Every level of the drill, every matrix, every view, and every solution profile has its own clean URL. The browser back and forward buttons walk your selections exactly, and you can bookmark or share any spot in the product. A colleague opening your link needs their own Nucleaus Pro sign-in.
Light and dark
The toggle at the top right switches between the light and dark themes. The icon shows the current theme, and your choice is remembered on that browser.
SmartSearch#
The bar on Home is SmartSearch, the default home experience: a complete, intelligent search of the entire Nucleaus database, answered directly from the live catalog. Type a company, a category, or a topic - the strongest matches appear as you type, ranked, with no query language to learn.
Results come back typed, so you always know what you are looking at:
- Cores, spectrums, and matrix - matched by name and description, each row linking to its own page in the drill.
- Solutions - labeled by how they matched: Solution when your term is the product itself, Subsidiaries when it is their parent organization, Parent org when the product is the parent of a match, and Mentioned when your term appears in a description or profile fact.
Every result is a link: a category lands on its page, a solution opens its profile. Spacing never blocks a match - "lang chain" finds LangChain.
Searching within pages
The Map, Hex, and My Map views carry their own search fields. They match solutions by product name (spaces forgiven - "lang chain" finds LangChain), parent organizations, subsidiaries, and descriptions that mention your term, with colored count pills showing each match type. Picking a solution zooms the canvas straight to it.
Market view#
Market is the one-picture summary of the whole catalog: a wheel with the three cores inside and the nine spectrums outside.
- Ring - inner ring is the cores; the outer ring is their spectrums.
- Size - a wedge's width is its share of all 3,104 solutions.
- Shade - darker wedges are mature, consolidated territory; lighter wedges are newer and still forming.
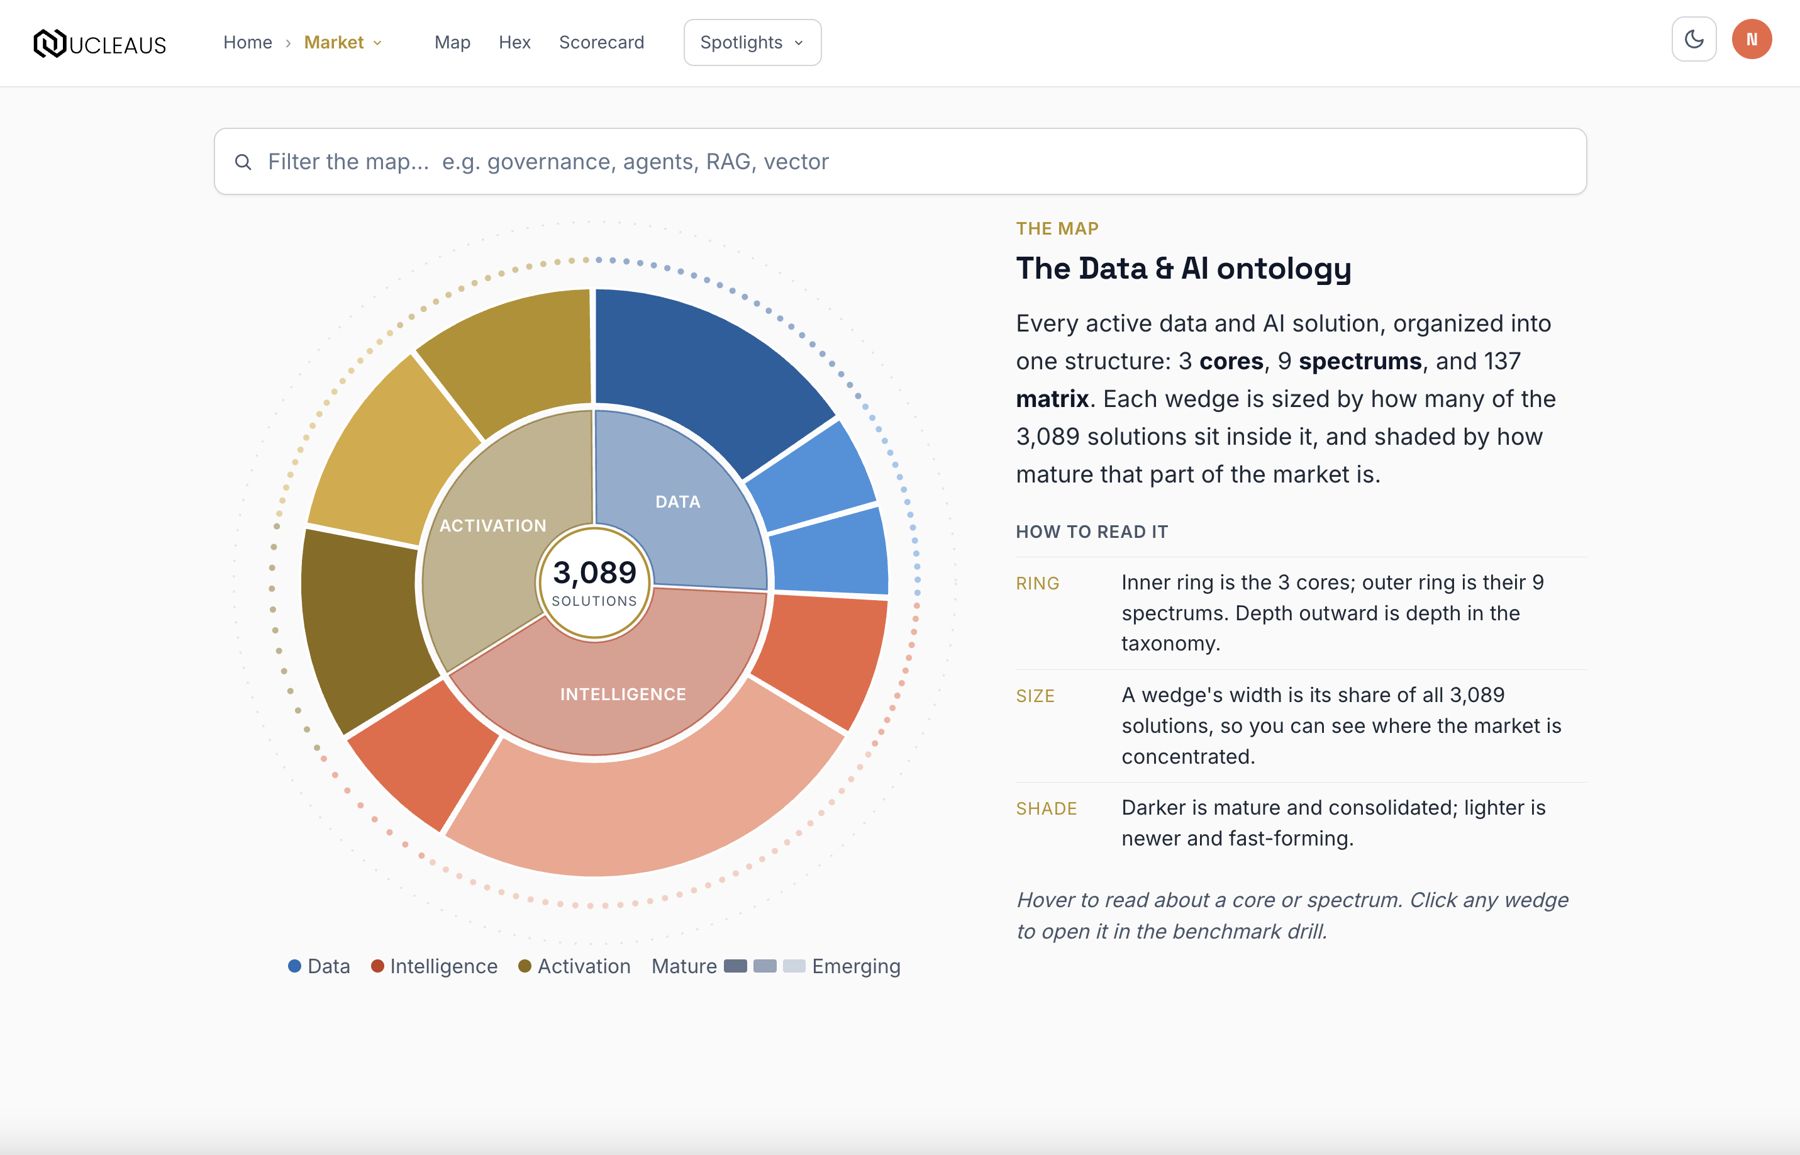
Hover any wedge to read it. Click a wedge to focus that core or spectrum: the side panel lists what lives inside, including chips for each matrix that jump straight to that matrix page. Click empty space to return to the whole market.
Ranked lists: Cores, Spectrums, Matrix#
The Cores, Spectrums, and Matrix pages rank the ontology by a measure you choose from the Measure by toolbar:
- Solutions - how many solutions live there (the default).
- Private - how many are privately held.
- Acquired - how many have been acquired.
- Paid - how many have a paid offering.
- Open source - how many have an open-source offering.
- Scores - average Overall, Capability, GTM, or Innovation score.
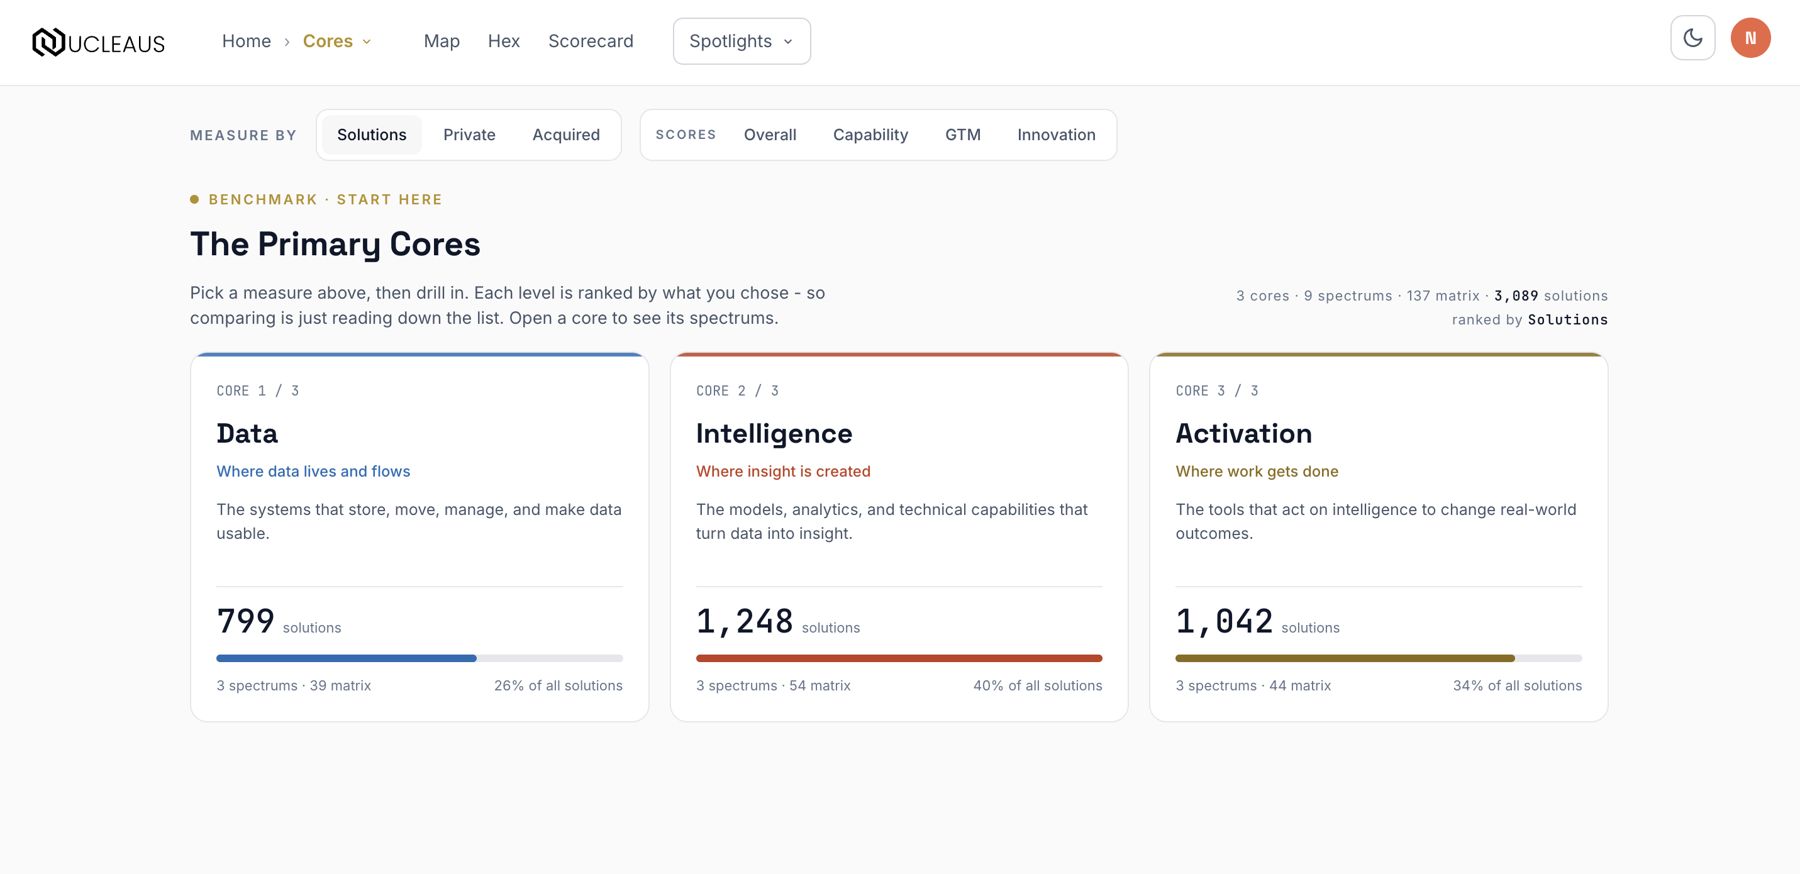
Each row carries a coverage caption stating how much of the group the measure covers, so you always know what a number is based on. Your chosen measure follows you as you drill deeper.
Matrix pages#
The matrix is where competition actually happens, and each one has a two-tab surface. Reach a matrix from anywhere: the drill, the Market wheel, search, a spotlight, or the Solutions browser (pick a matrix from the dropdown; Core and Spectrum narrow the list).
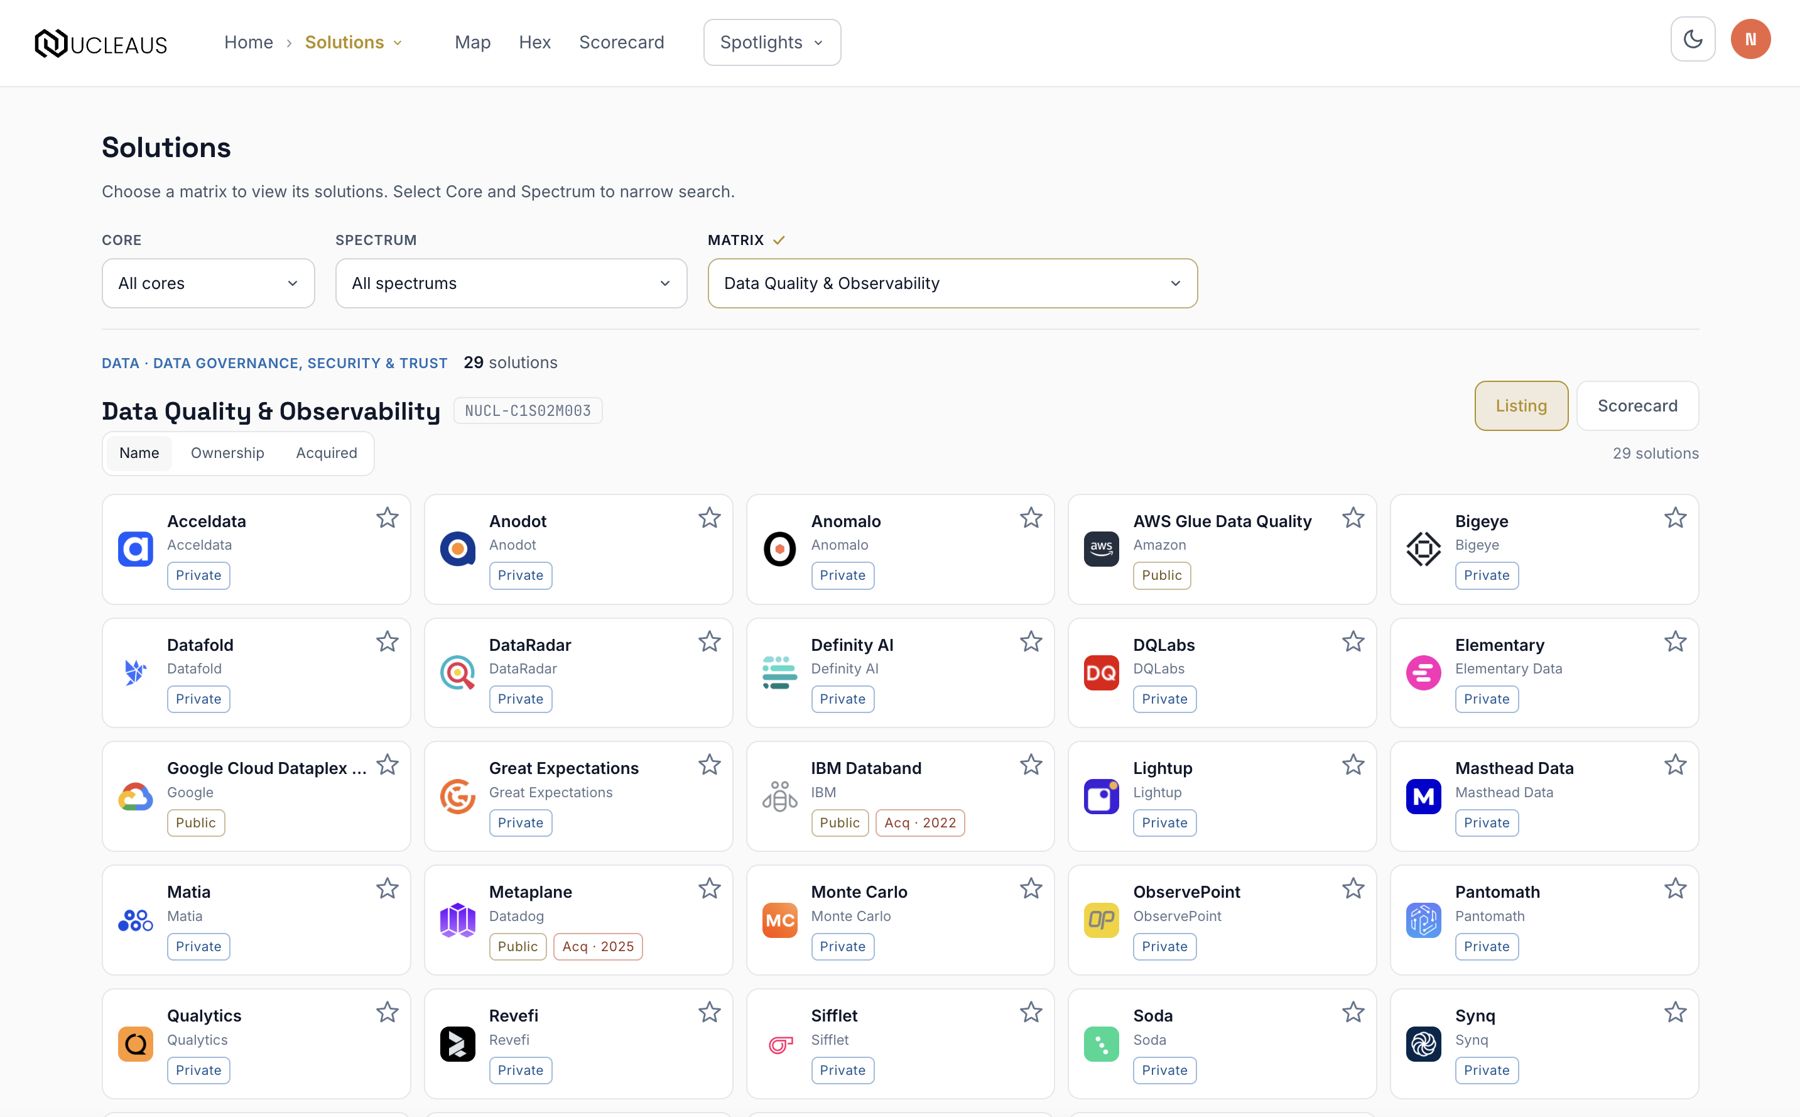
Listing
The full roster as solution cards - name, logo, parent organization, and status chips. Sort by Name, Ownership, or Acquired. The Acquired, Paid, and Open source chips above the roster filter it. Click a card to open the solution's detail rail; the star on each card saves it to My Map.
Scorecard
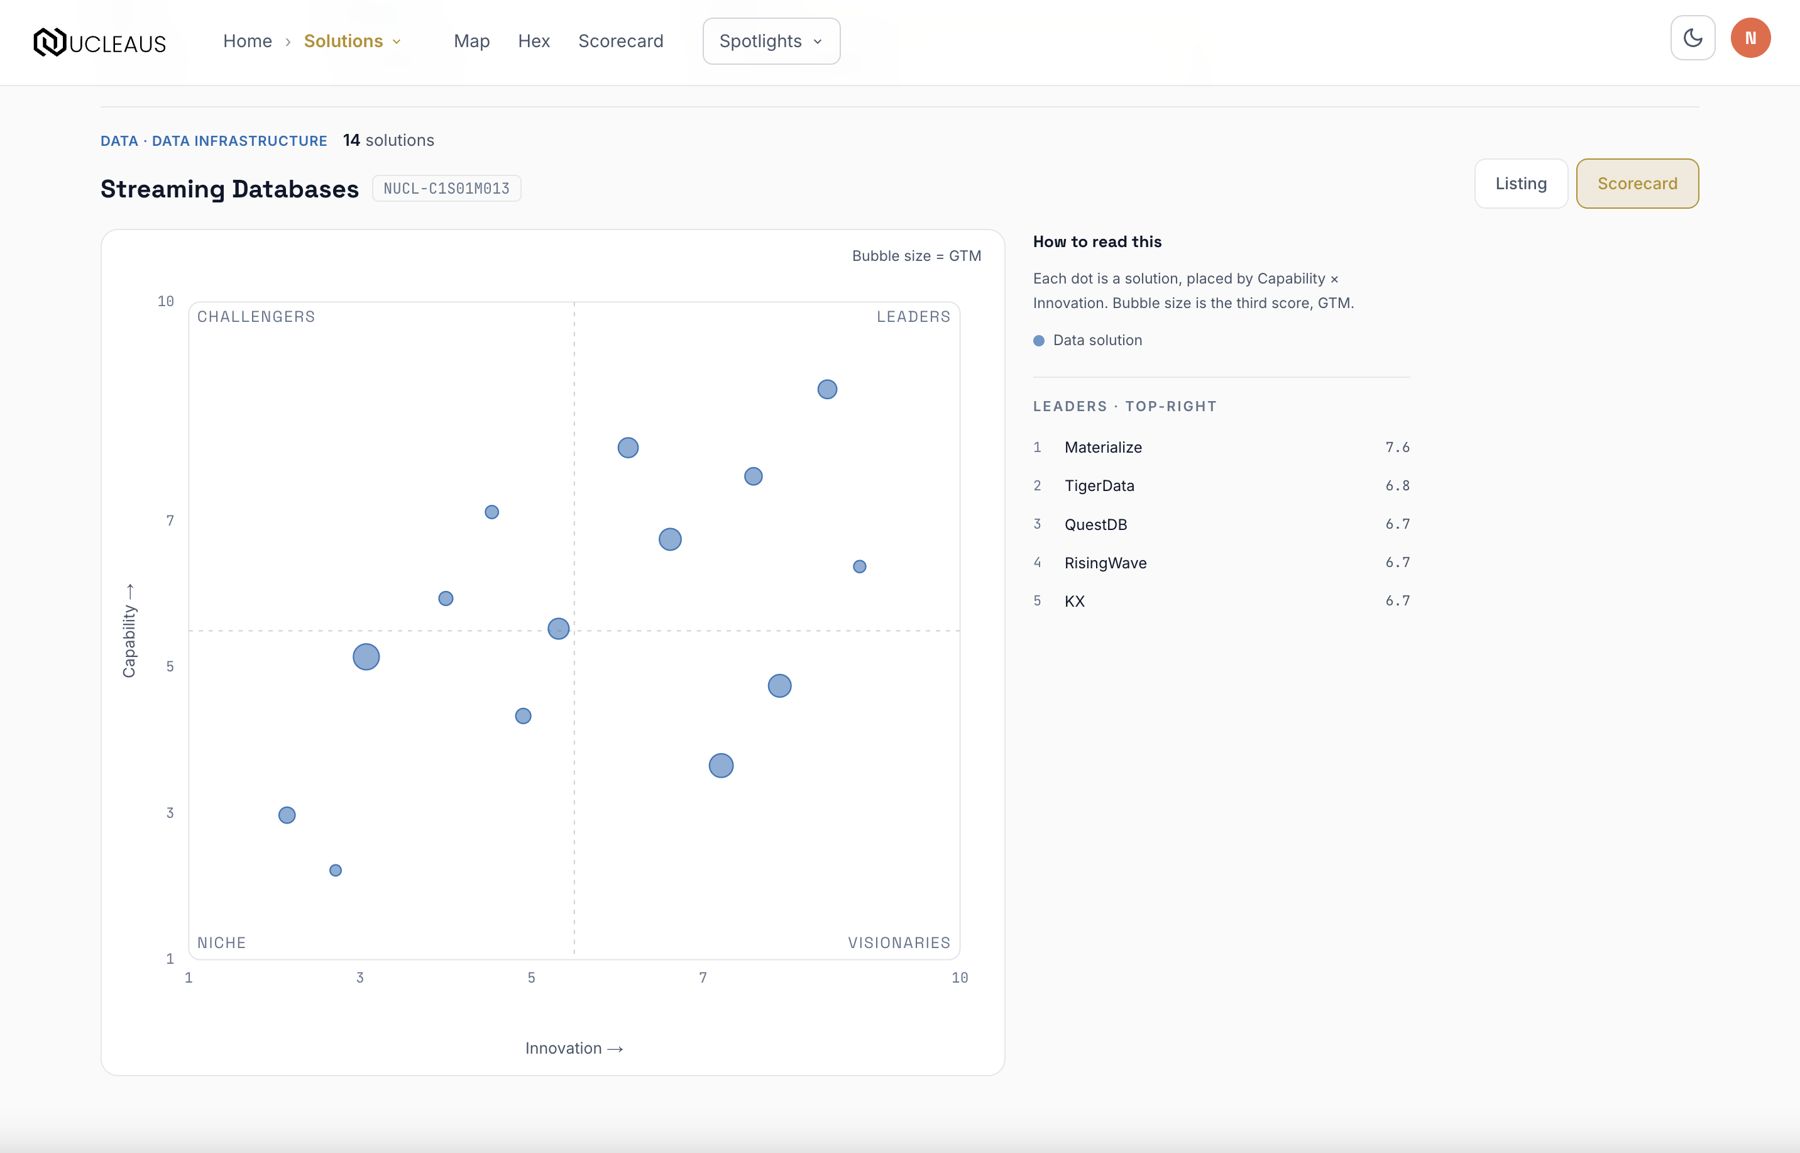
The same roster as a quadrant chart. See Scorecards for how to read it - every scorecard in the product reads exactly the same way.
Map & Hex#
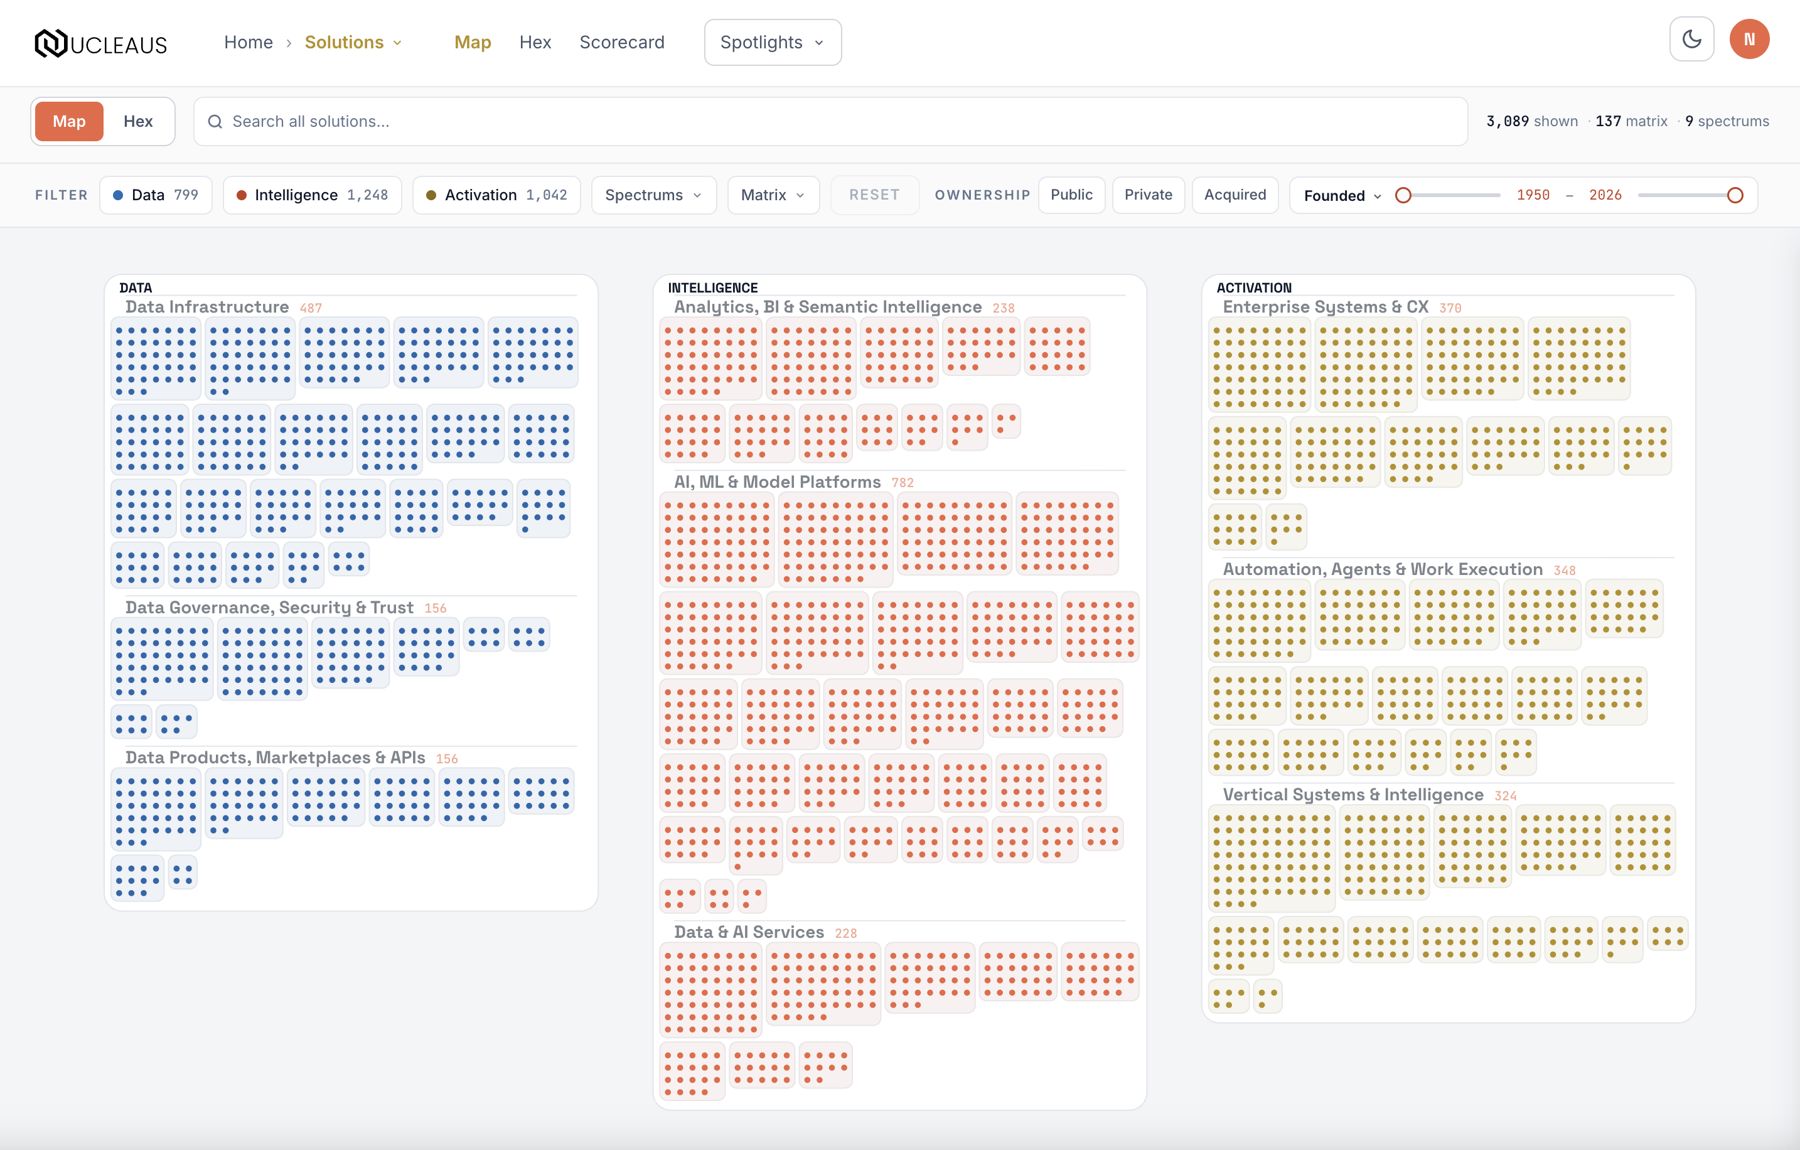
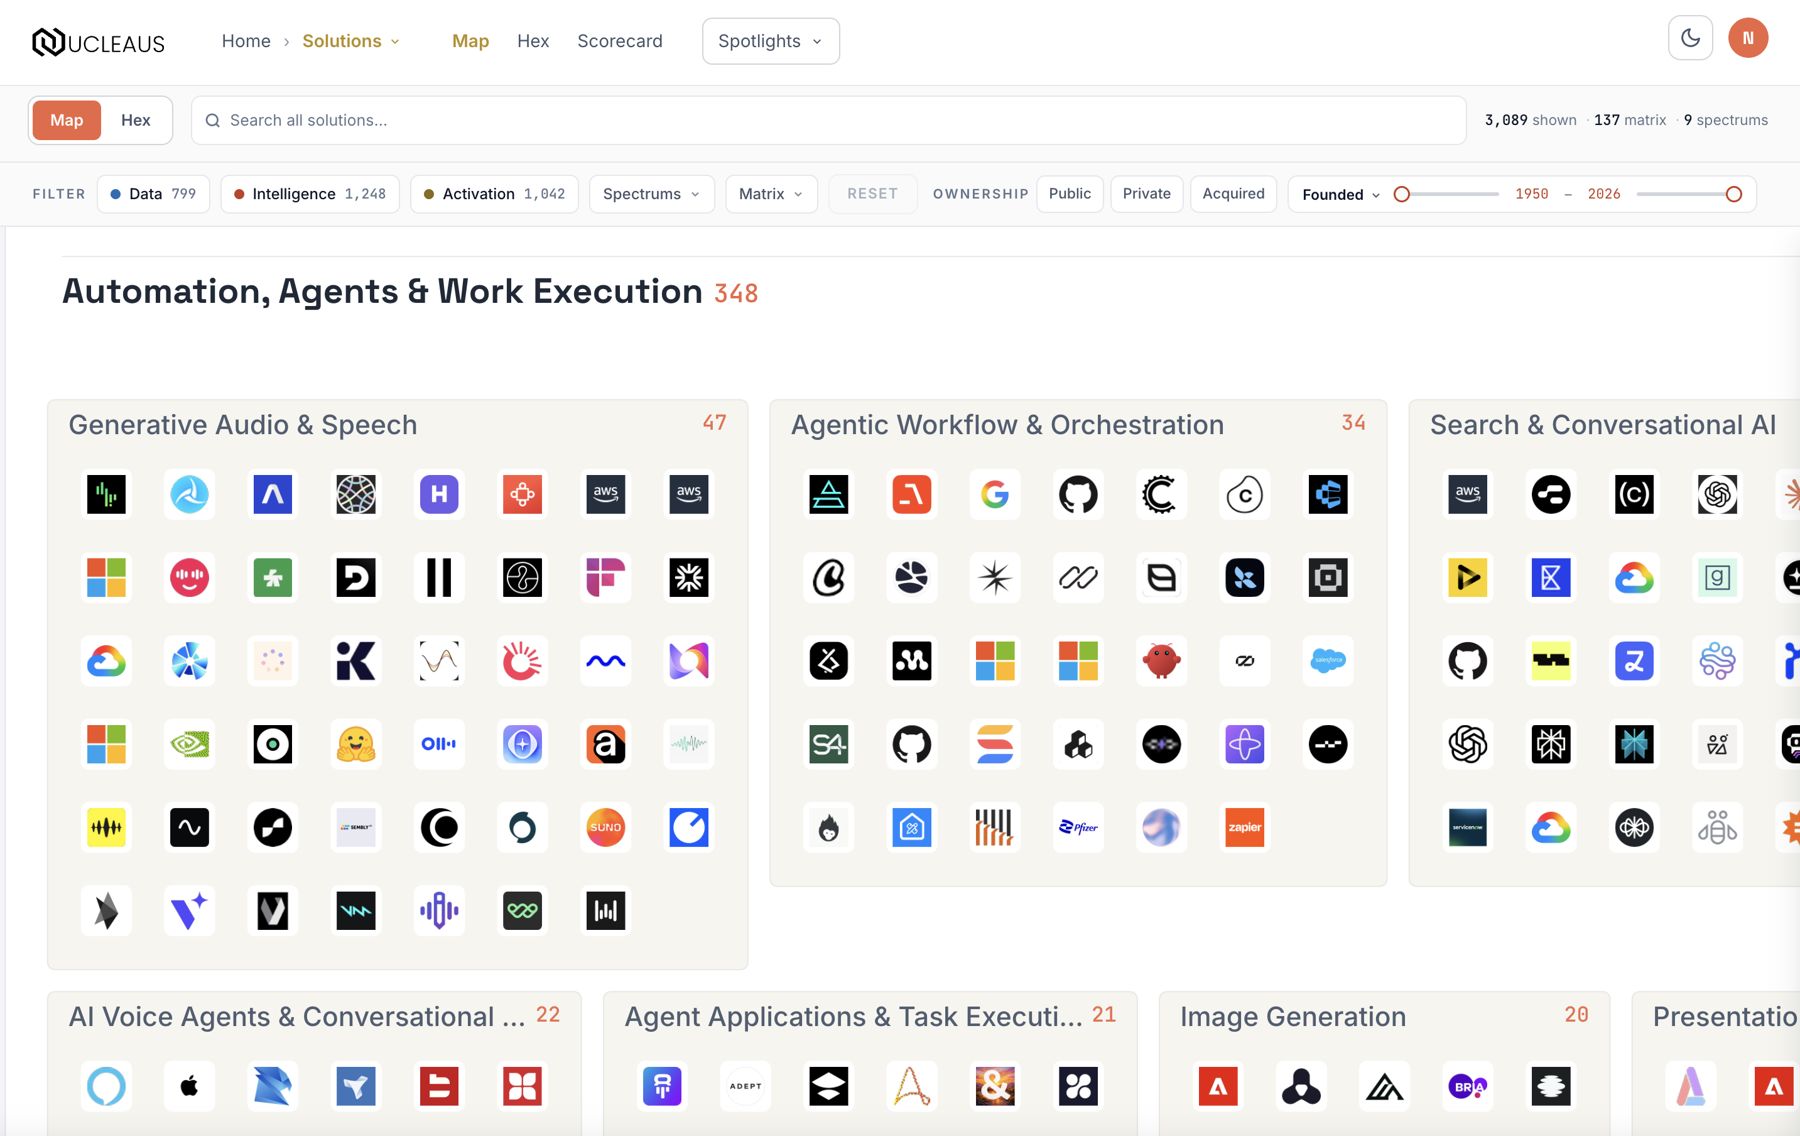
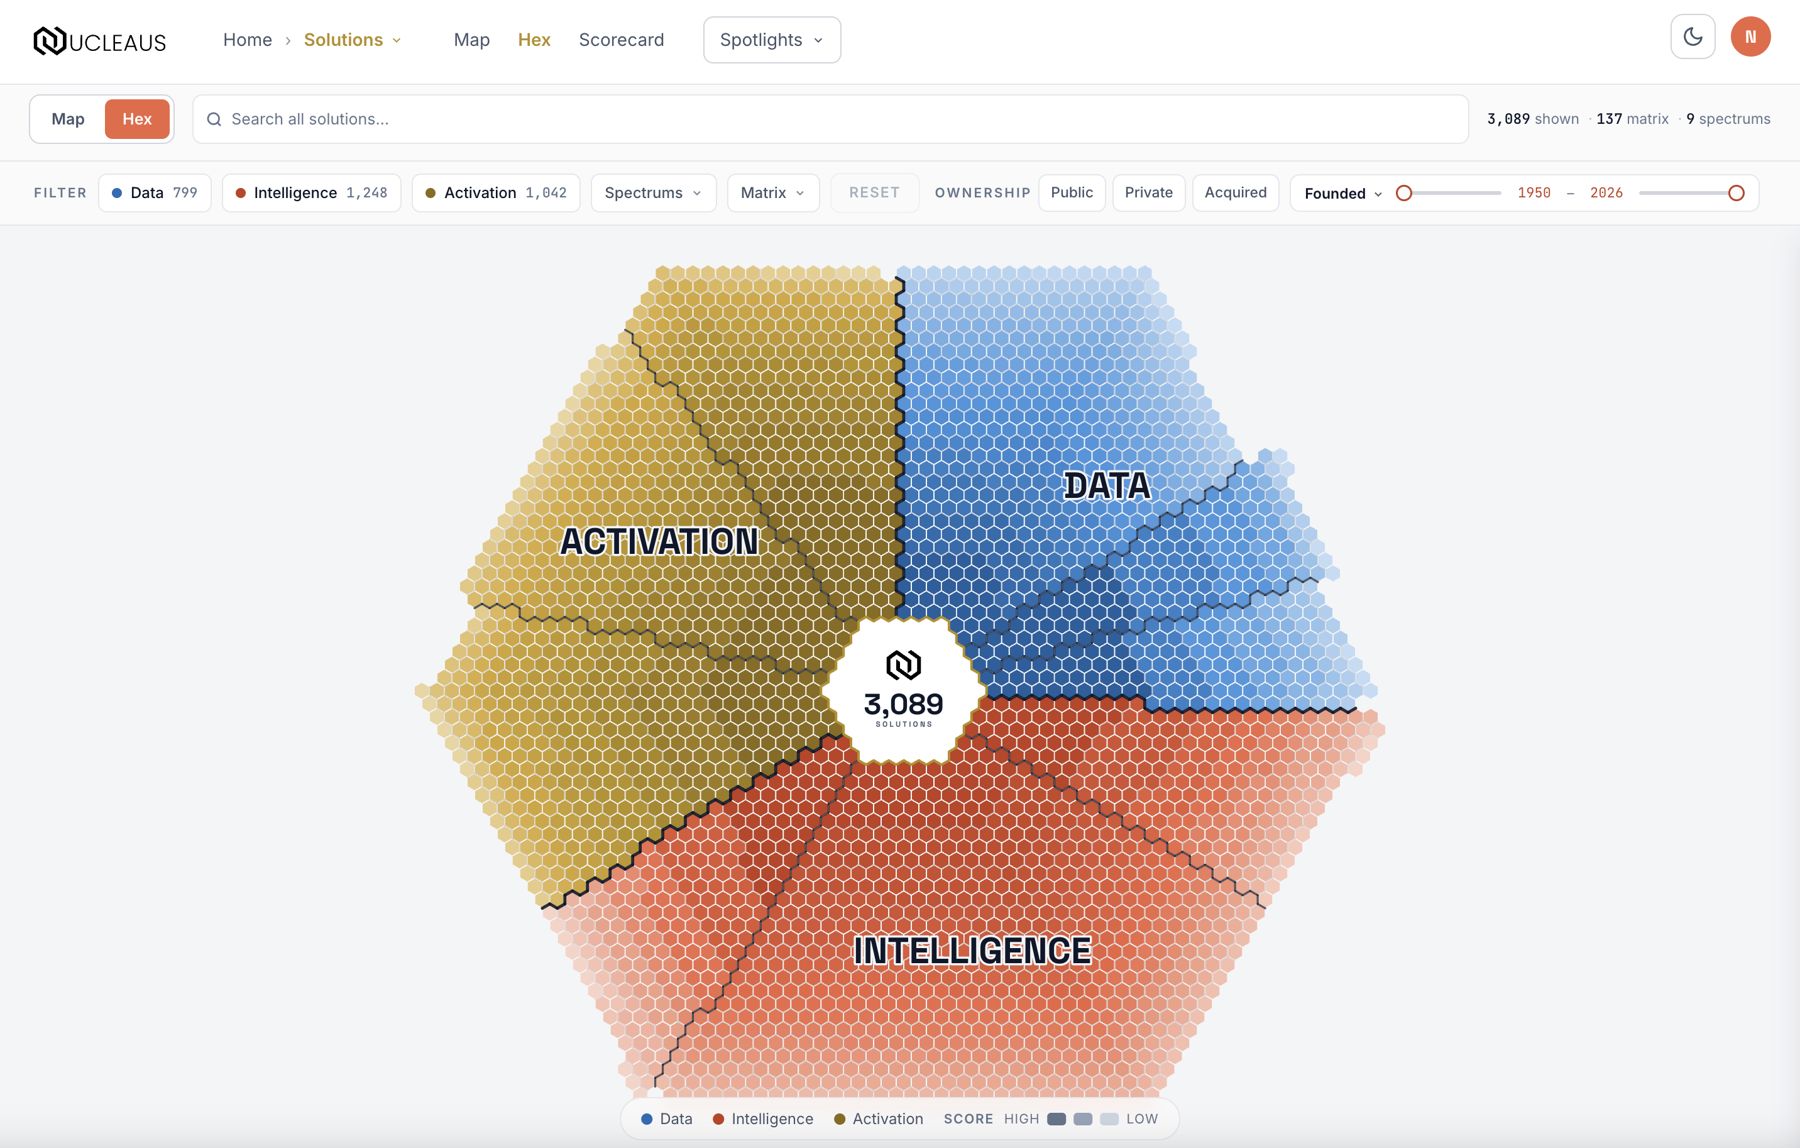
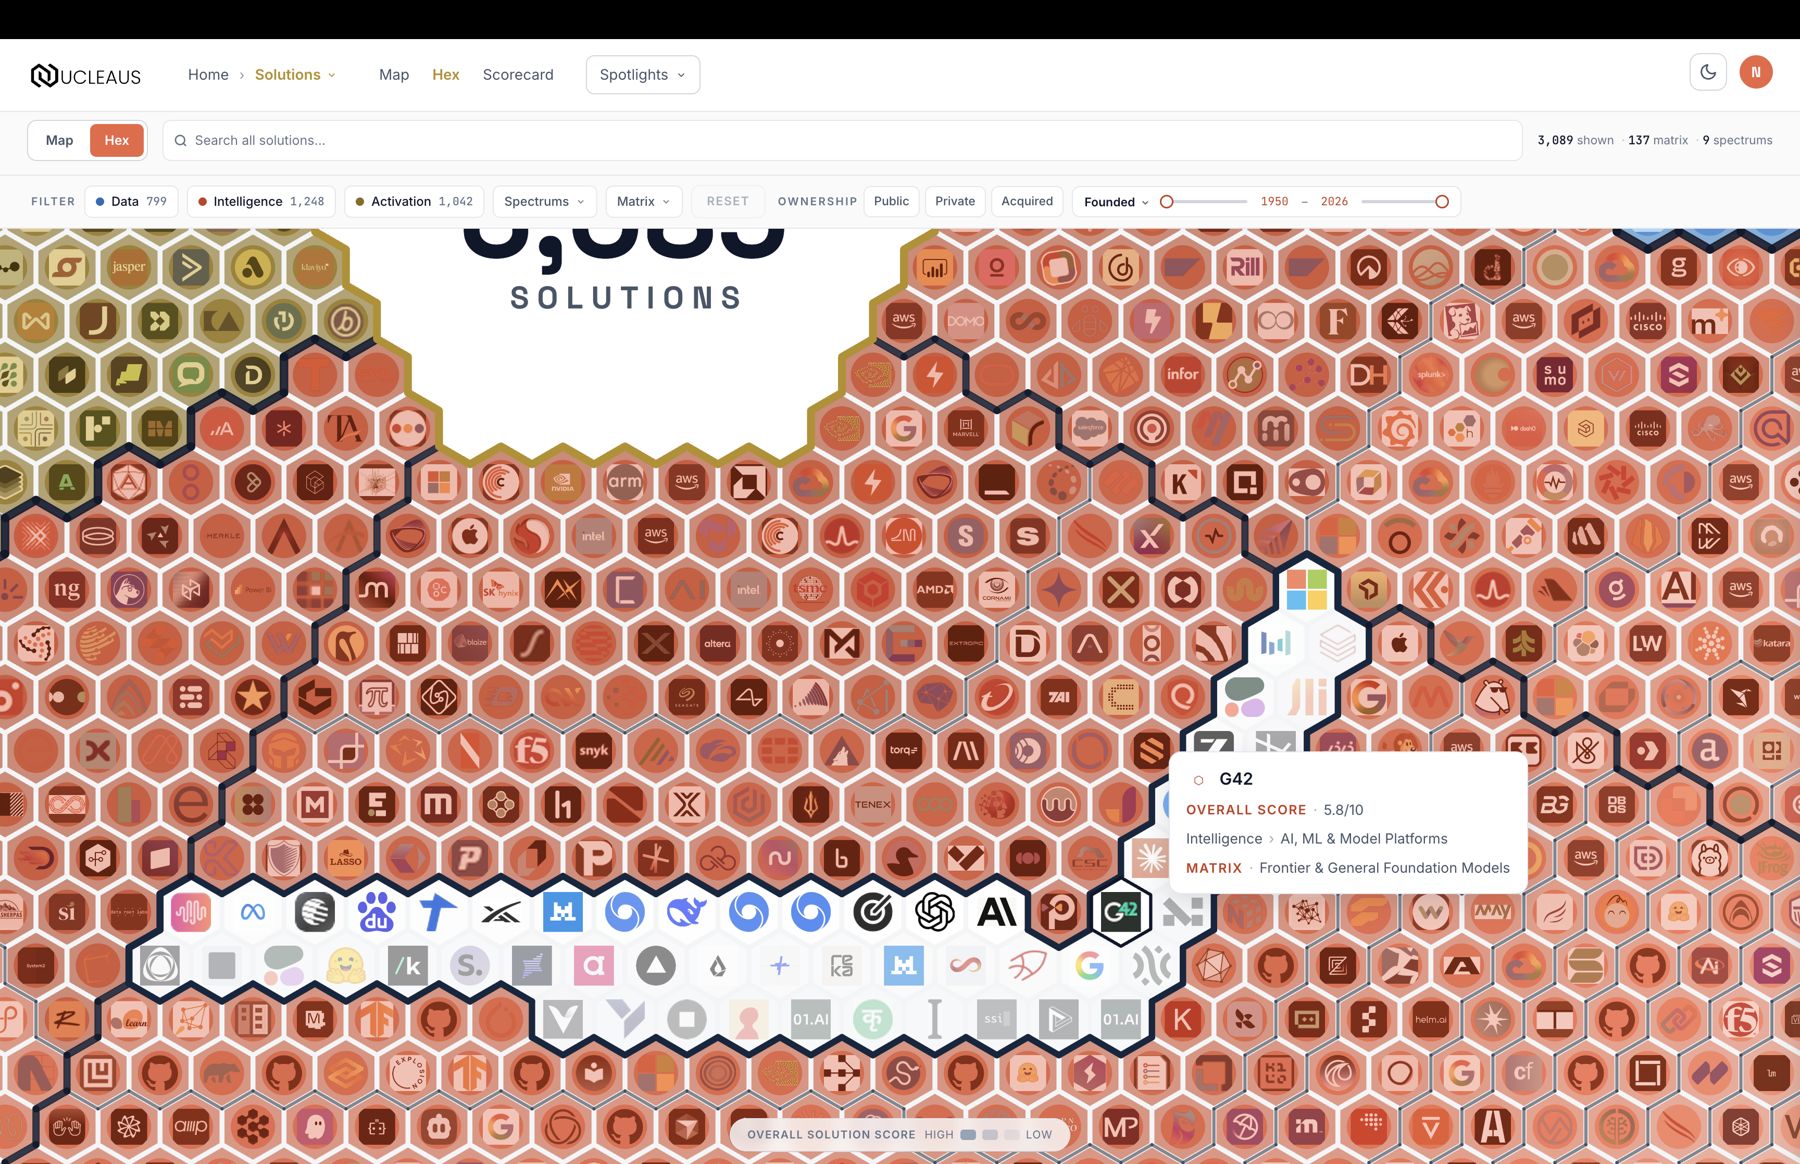
The two canvas views put every solution in the catalog on screen at once, organized by the ontology and colored by core. They share one toolbar: the Map/Hex toggle, the search field, live counts, and the filter bar.
Map
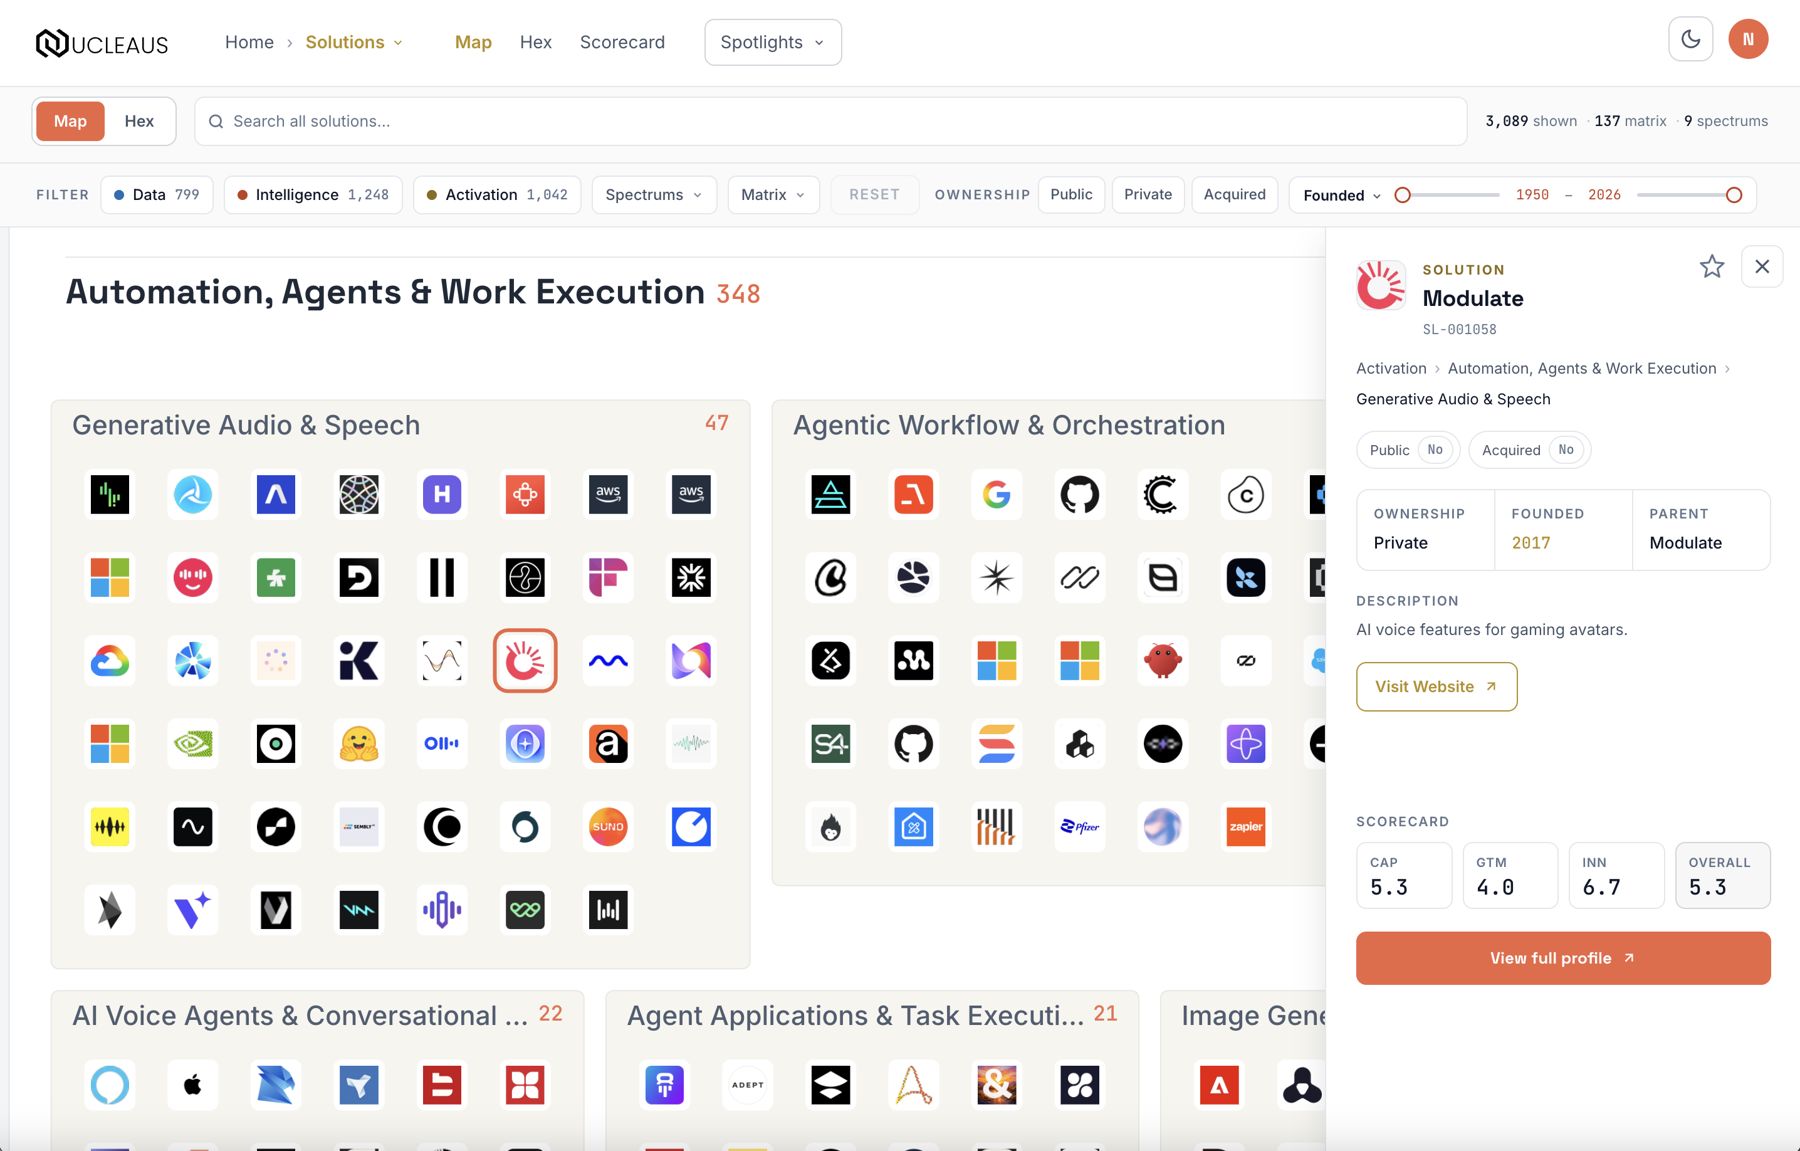
Map draws each matrix as a box of solution dots, grouped by core. Pan by dragging, zoom with the wheel or a pinch. Zoom in and the dots become company logos. The view is bounded, so you can never fling the map off into empty space or zoom out past the whole picture.
Hex
Hex tiles the market into a single honeycomb, with the three cores as shaded regions and each solution as one hexagon. Hovering traces a matrix's outline and reads out its solution count and total score. It is the presentation-friendly way to show the shape of the whole market.
The detail rail
Clicking a solution on either canvas opens the rail: identity, breadcrumb, status chips, key facts, description, a Visit website button, and mini scores. The map stays fully interactive while the rail is open; close it with its × or by clicking empty canvas. View full profile takes you to the complete page.
Filters#
The filter bar on Map and Hex reads left to right as a sentence about your working set:
- Core pills - click a core to focus it alone; click it again to return to all cores. Counts on each pill stay live.
- Spectrums & Matrix - multi-select dropdowns that cascade: the spectrum list follows your cores, the matrix list follows your spectrums.
- Reset - clears every filter and the search in one click.
- Ownership - Public, Private, Acquired.
- Access - Paid, Open source.
- Range slider - pick its metric: Dates (Founded or Acquired year) or Scores (Overall, Capability, GTM, Innovation, 1-10 in 0.1 steps). Both handles drag live, and they push each other so they can meet on a single value.
Three rules keep the bar predictable:
- Search comes first. The search query defines the base set; every filter narrows within it, and the shown counts always reflect the intersection.
- The hierarchy stays in sync. Picking a spectrum or matrix lights up the cores it implies. Clicking a core switches focus to it and clears deeper picks; changing spectrums clears matrix picks.
- Reset tells you when it matters. The Reset button lights up warm whenever any filter or search is active, so an oddly small view is never a mystery.
Scorecards#
Every scorecard in Nucleaus reads the same way, so you only learn it once:
- x-axis - Innovation score.
- y-axis - Capability score.
- Bubble or icon size - GTM score.
- Color - the matrix's core.
Up and to the right is strong on both axes; bigger marks carry more go-to-market weight. Hover any mark for the exact Overall, Capability, GTM, and Innovation values, and read the ranked Leaders list beside the chart. The Acquired, Paid, and Open source chips filter the chart in place, and the heading switches to Filtered leaders so you know a filter is on.
The standalone Scorecards page is a matrix picker: it starts empty on purpose. Choose a matrix (Core and Spectrum just narrow the list) and its quadrant renders. From any solution profile, the Scorecard button and the four score boxes jump here with that solution highlighted and everything else dimmed - your first click releases the highlight.
Solution profiles#
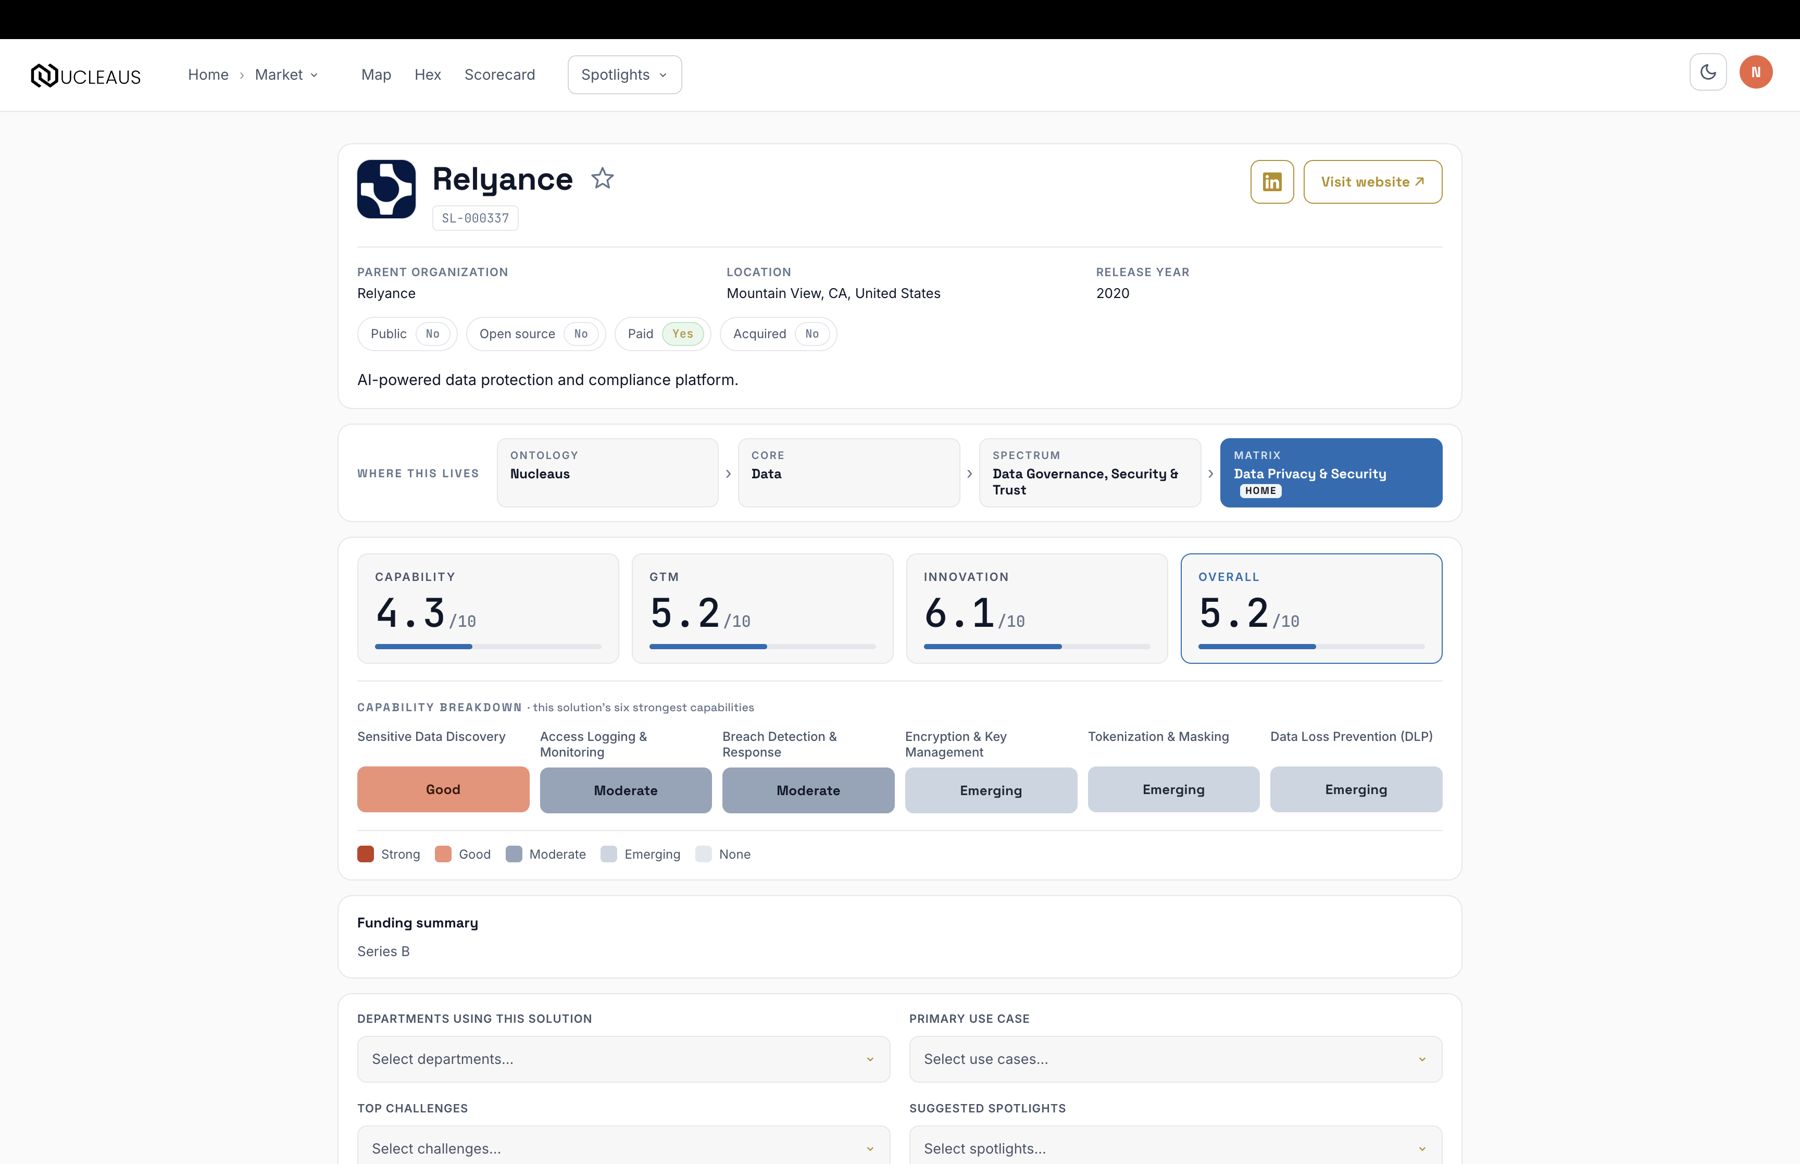
The profile is the complete record of one solution, on its own page you can bookmark and share. Top to bottom:
- Header - logo, name, and solution ID, with LinkedIn, X, GitHub, and Visit website actions where a link is on record, plus the Scorecard button.
- Key facts - parent organization, location, release year, total funding, funding rounds, and key individuals.
- Status chips - Public, Open source, Paid, Acquired, each a clear yes or no.
- Description - what the solution actually does.
- Where this lives - the solution's home in the ontology, each node a link back into the drill.
- Scorecard - the four scores with Overall leading, then the capability breakdown: six capability areas for its matrix, each rated on a tier scale from Strong down to None.
- Notes - acquisition details, funding summary, and open-source notes, each shown when there is something on record.
Spotlights#
Spotlights are the curated, editorial layer on top of the catalog - a guided read on where the market is moving. There are two tracks:
- Market Trends Spotlight - the themes shaping Data & AI right now, placed by how much attention each carries and how far it has moved from struggling toward working.
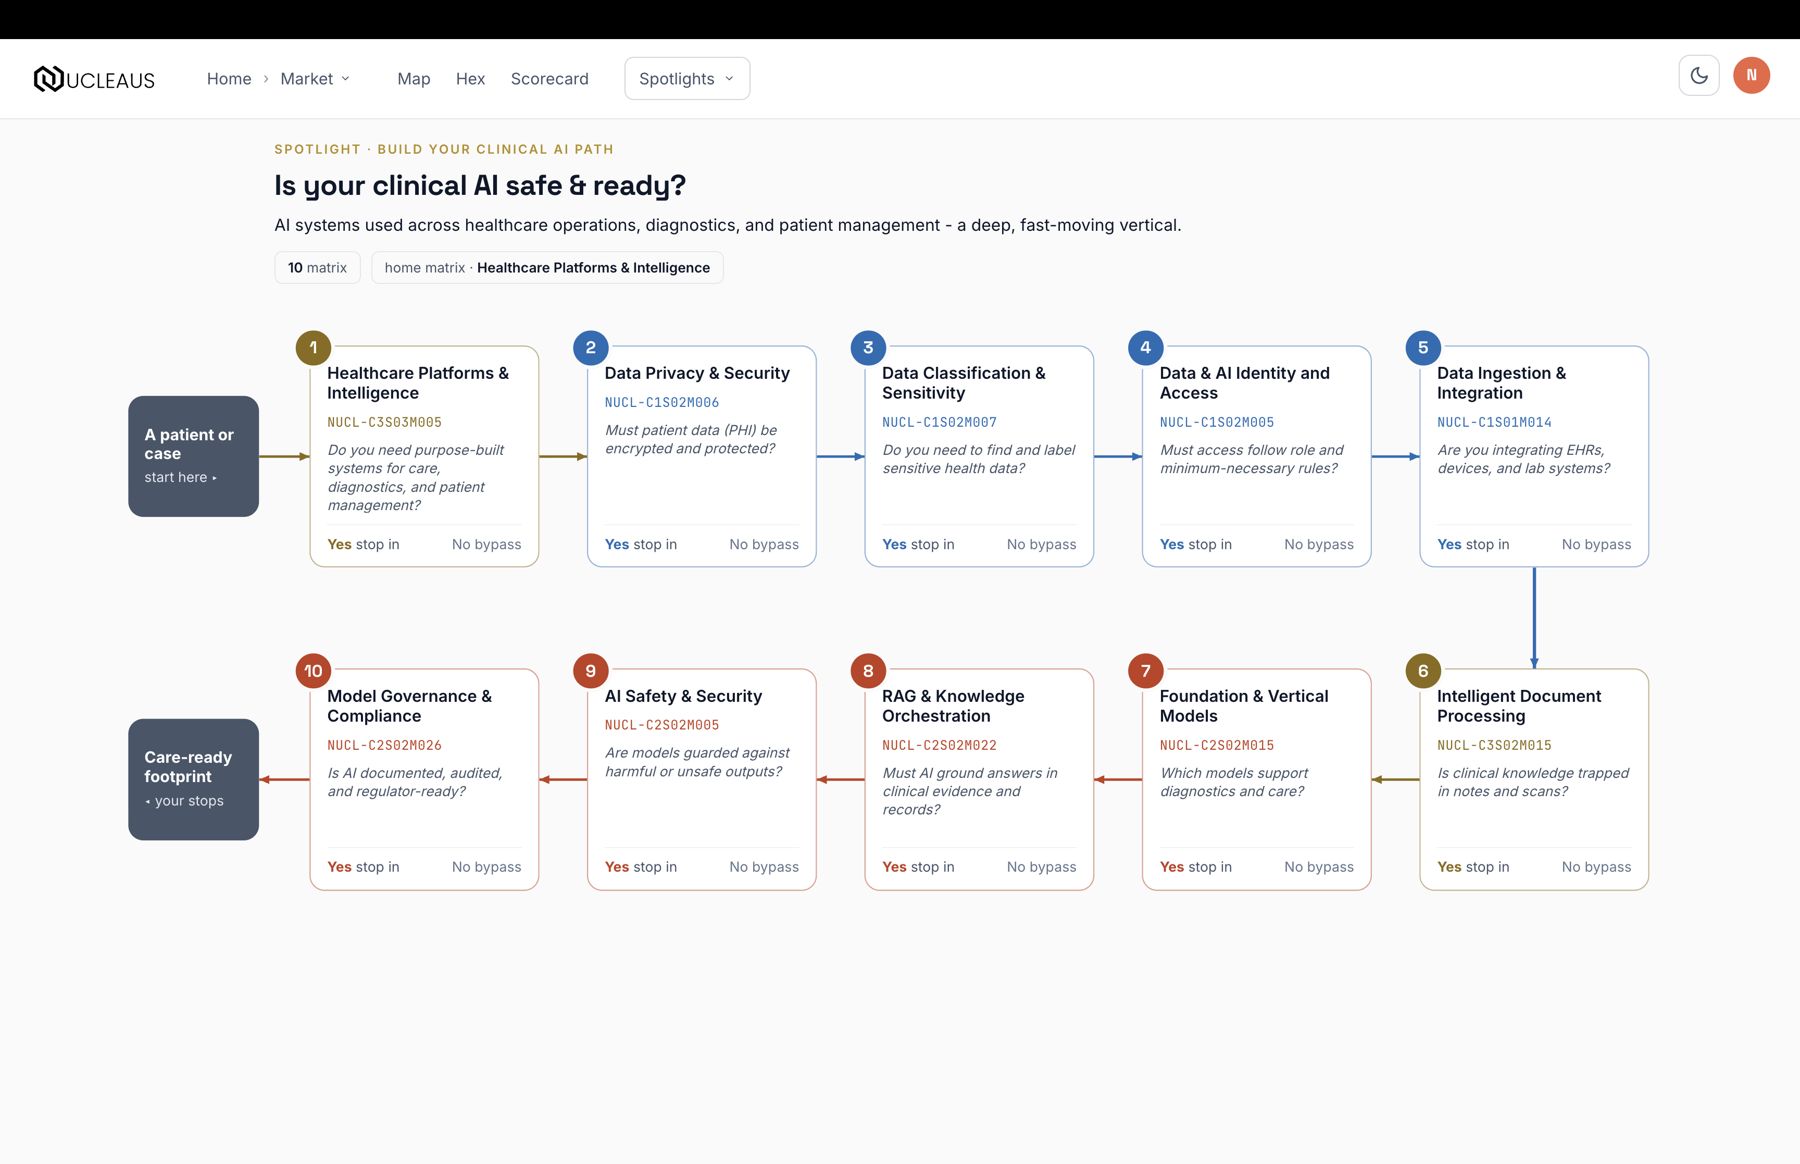
- Market Vertical Spotlight - industry verticals placed by AI adoption maturity and market activity.
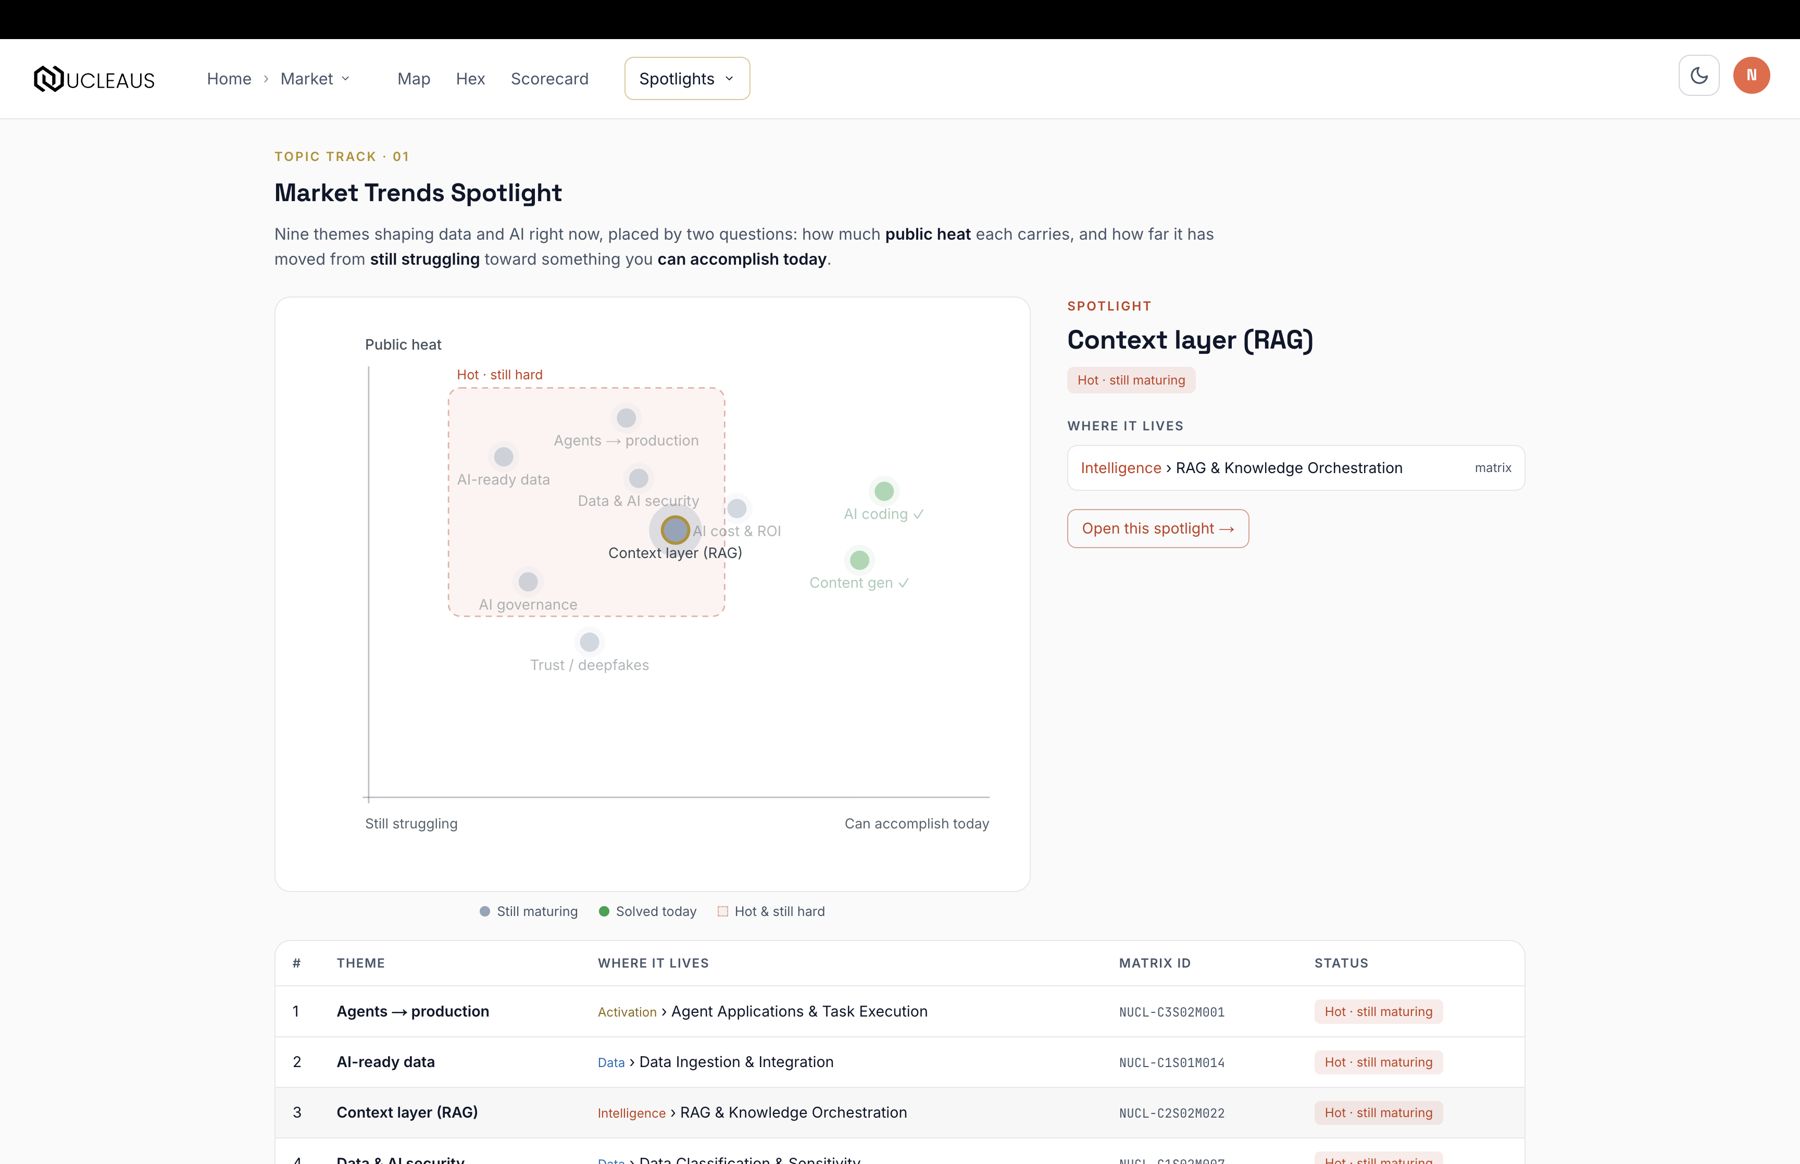
Click any theme or vertical to open its journey page: a step-by-step flow of the decisions and capability gates that theme runs through, each gate linked to the matrix where those solutions live. Spotlights are how you go from "what is going on with agents" to the exact categories and vendors involved.
Nucleaus LLM (Beta)#
The Nucleaus LLM is the beta prompt experience for the Home bar. Ask in plain language - a company, a category, or how something works - and press Enter: Nucleaus replies in a short, clear answer with clickable results underneath, and you can keep the conversation going with follow-up questions. It reasons over the whole catalog, grounded in the Nucleaus dataset rather than the open web. There is no person on the other side: Nucleaus answers on its own, from the data.
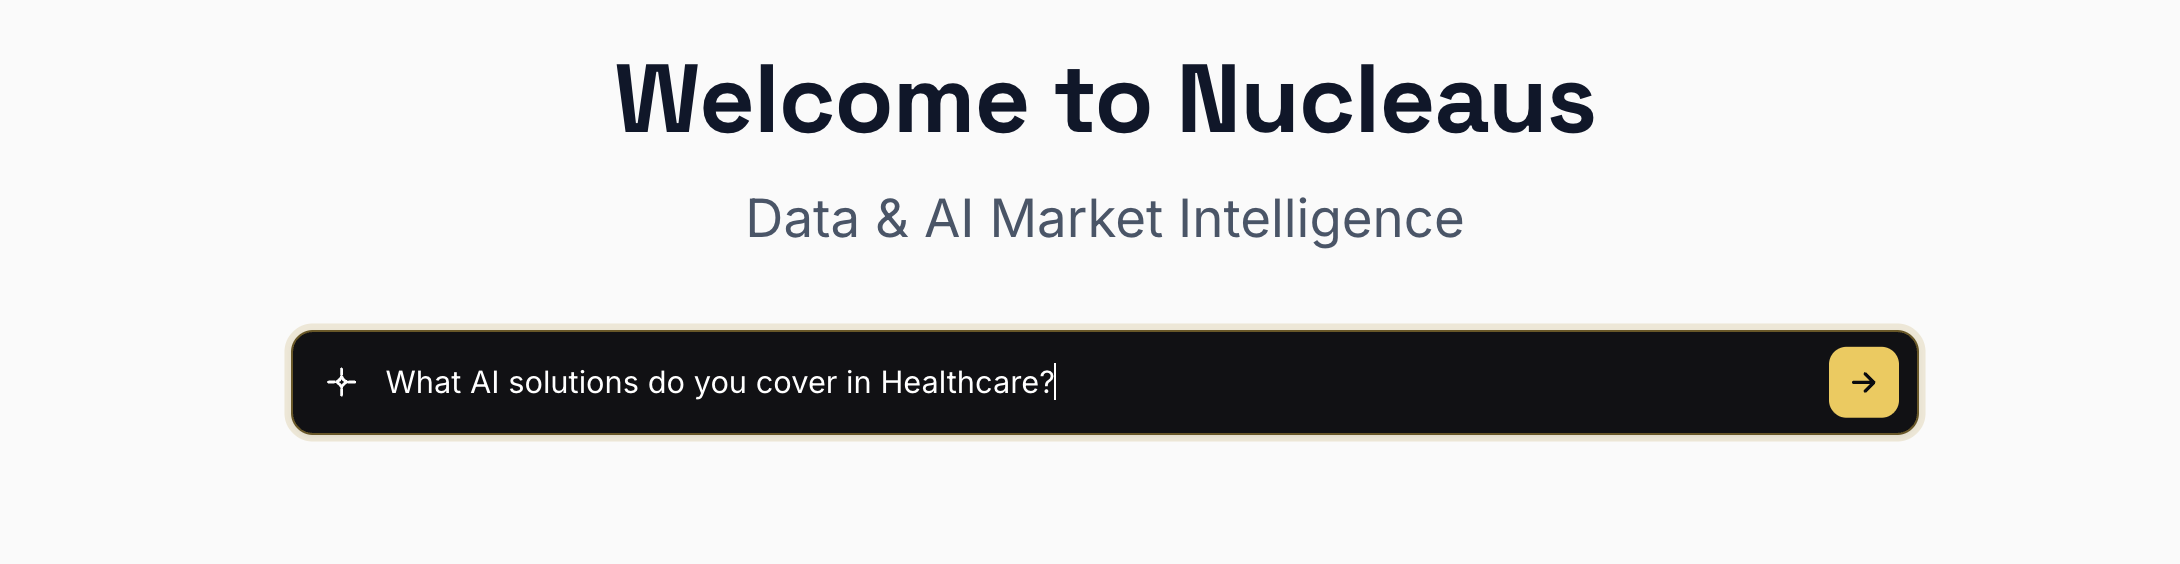
Nucleaus understands plain language, and a little structure makes it precise. Type / anywhere in your question and three commands appear: /core, /spectrum, and /matrix. Each opens a picker of real category names - no guessing at spelling.
Pills
Picking a name drops it into your sentence as a pill, exactly where you were typing. A pill behaves like a single character: backspace deletes it whole, and clicking the small caret on the pill reopens the picker to swap it for another. The pickers cascade - once a core is in the question, the spectrum list narrows to that core, and a picked spectrum narrows the matrix list.
Pill + a short question
A pill followed by a few words is often the whole prompt - the request scopes to that category:
/spectrum show the underfunded standouts/matrix show the outliers/core by timeWhat you can ask
Counts ("how many are open source?"), breakdowns per year, core, spectrum, matrix, country, funding stage, or ownership, relationships ("funding vs overall score"), underfunded standouts and overfunded outliers, two-dimension heatmaps ("solutions by core and year"), and refinements of the chart you're looking at ("only since 2010", "without anything under $10M").
solutions per coreaverage funding per spectrumhow many acquired per year since 2015?does innovation correlate with GTM?show me the underfunded standoutsoverfunded and underfunded outliers in DataSaving with stars: My Map#
Wherever you see a star - roster cards, the detail rail, a profile - clicking it saves that solution to My Map, your personal board. The My Map button in the header carries your live count.
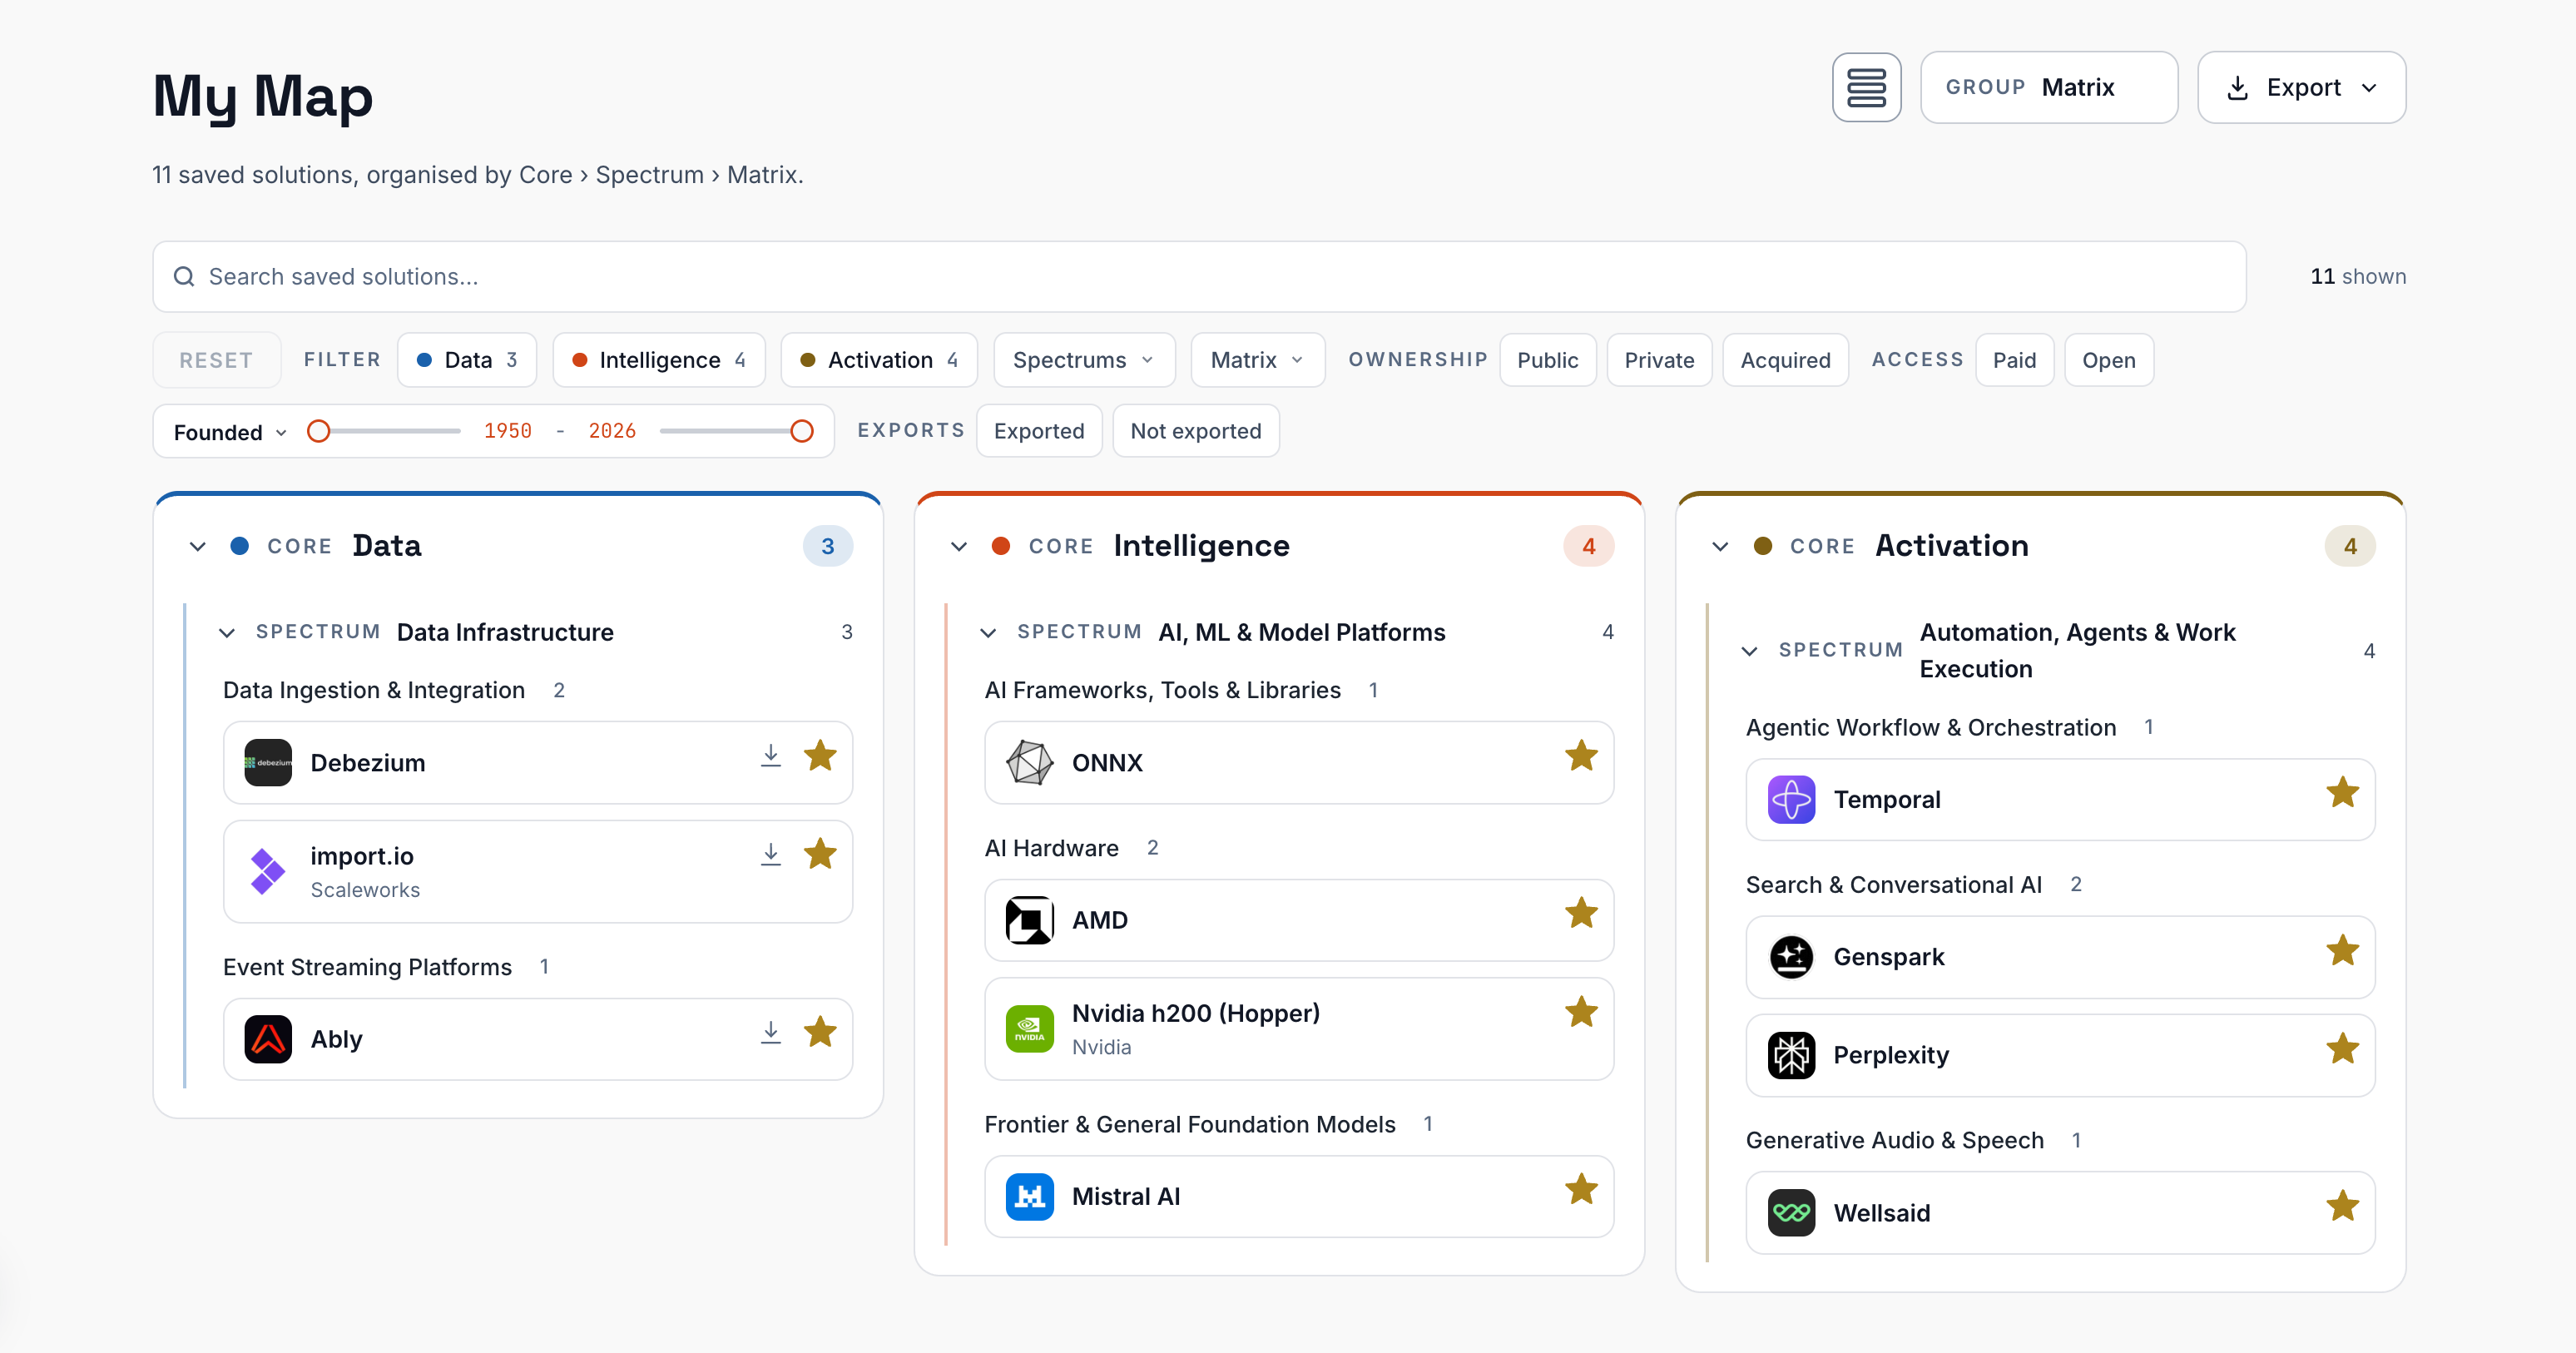
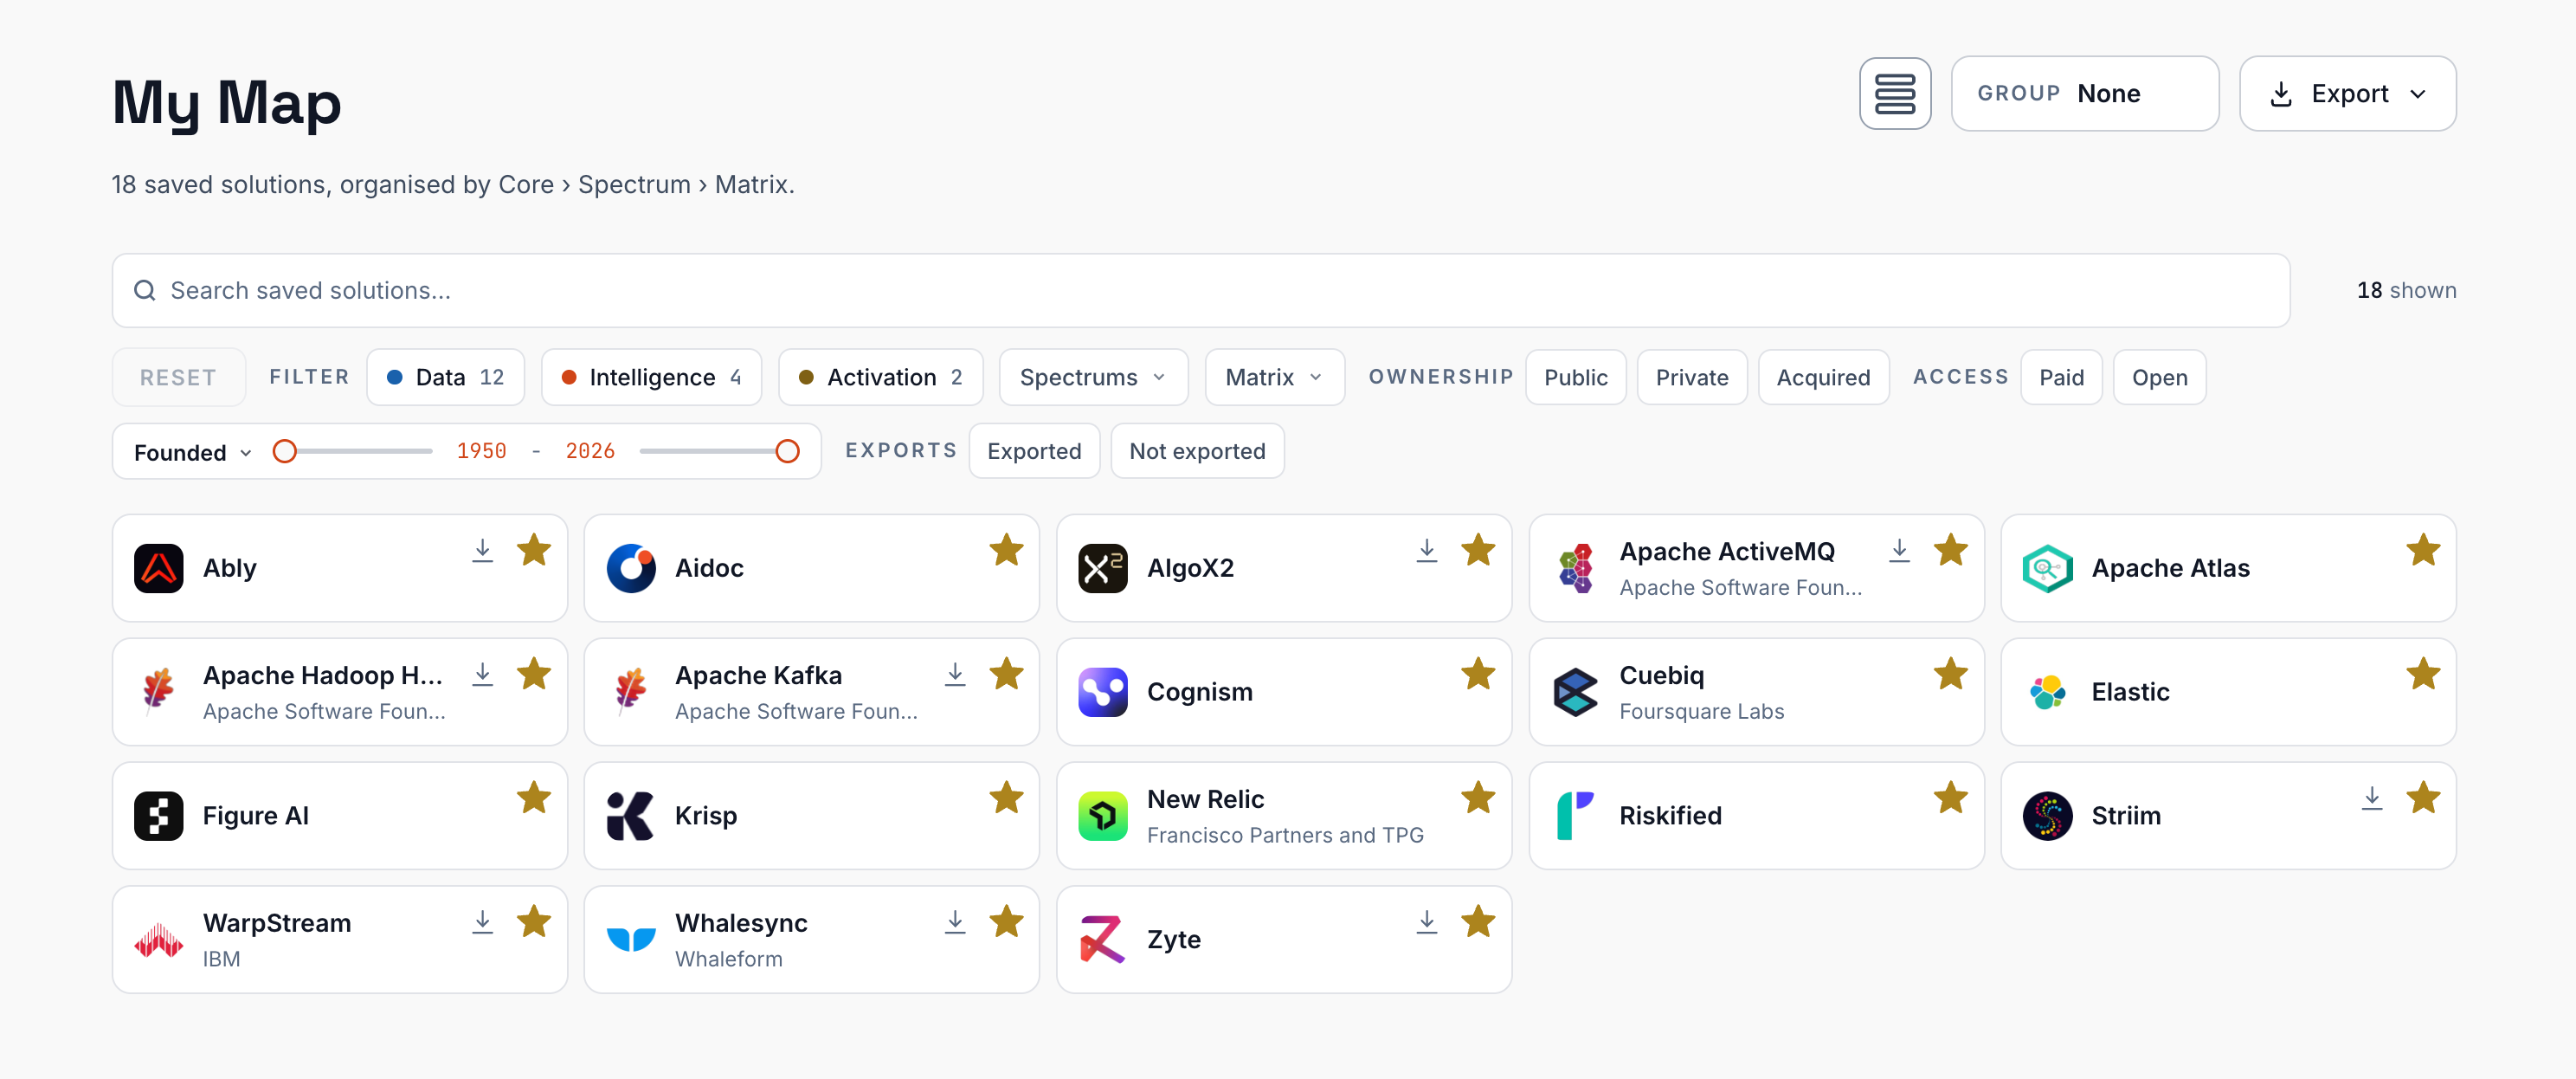
- Grouping - the board organizes itself by where solutions live. The Group control cycles the depth: Matrix, Spectrum, Core, or a flat ungrouped board.
- Two layouts - core columns of compact cards, or a listing of full-width rows. The view toggle sits left of the Group button.
- Filters - the same filter bar as the Map, plus an Exports facet (Exported / Not exported) once you have card exports this month.
- Search highlights, never hides. Searching your board rings the matching cards by match type and scrolls to them, but it does not remove anything - so a search never changes what an export contains.
- Removing - click a saved star to remove the solution; its tooltip reads Remove from My Map.
Grouping the board
The Group control sets how much structure the board shows: Matrix, Spectrum, Core, or None. Grouped by Matrix - the deepest setting - your solutions sit in one column per core, nested under their spectrum and matrix, so the board reads as a map of where everything you saved lives. Group None removes the structure entirely: the same solutions as one flat, alphabetical grid - the quickest way to scan everything you have starred. Spectrum and Core sit in between, keeping the columns but grouping less deeply.
You can hold up to 100 stars at any time. At the limit, the star on an unsaved solution explains itself on hover; remove a star anywhere and the slot frees up immediately.
Solution card exports#
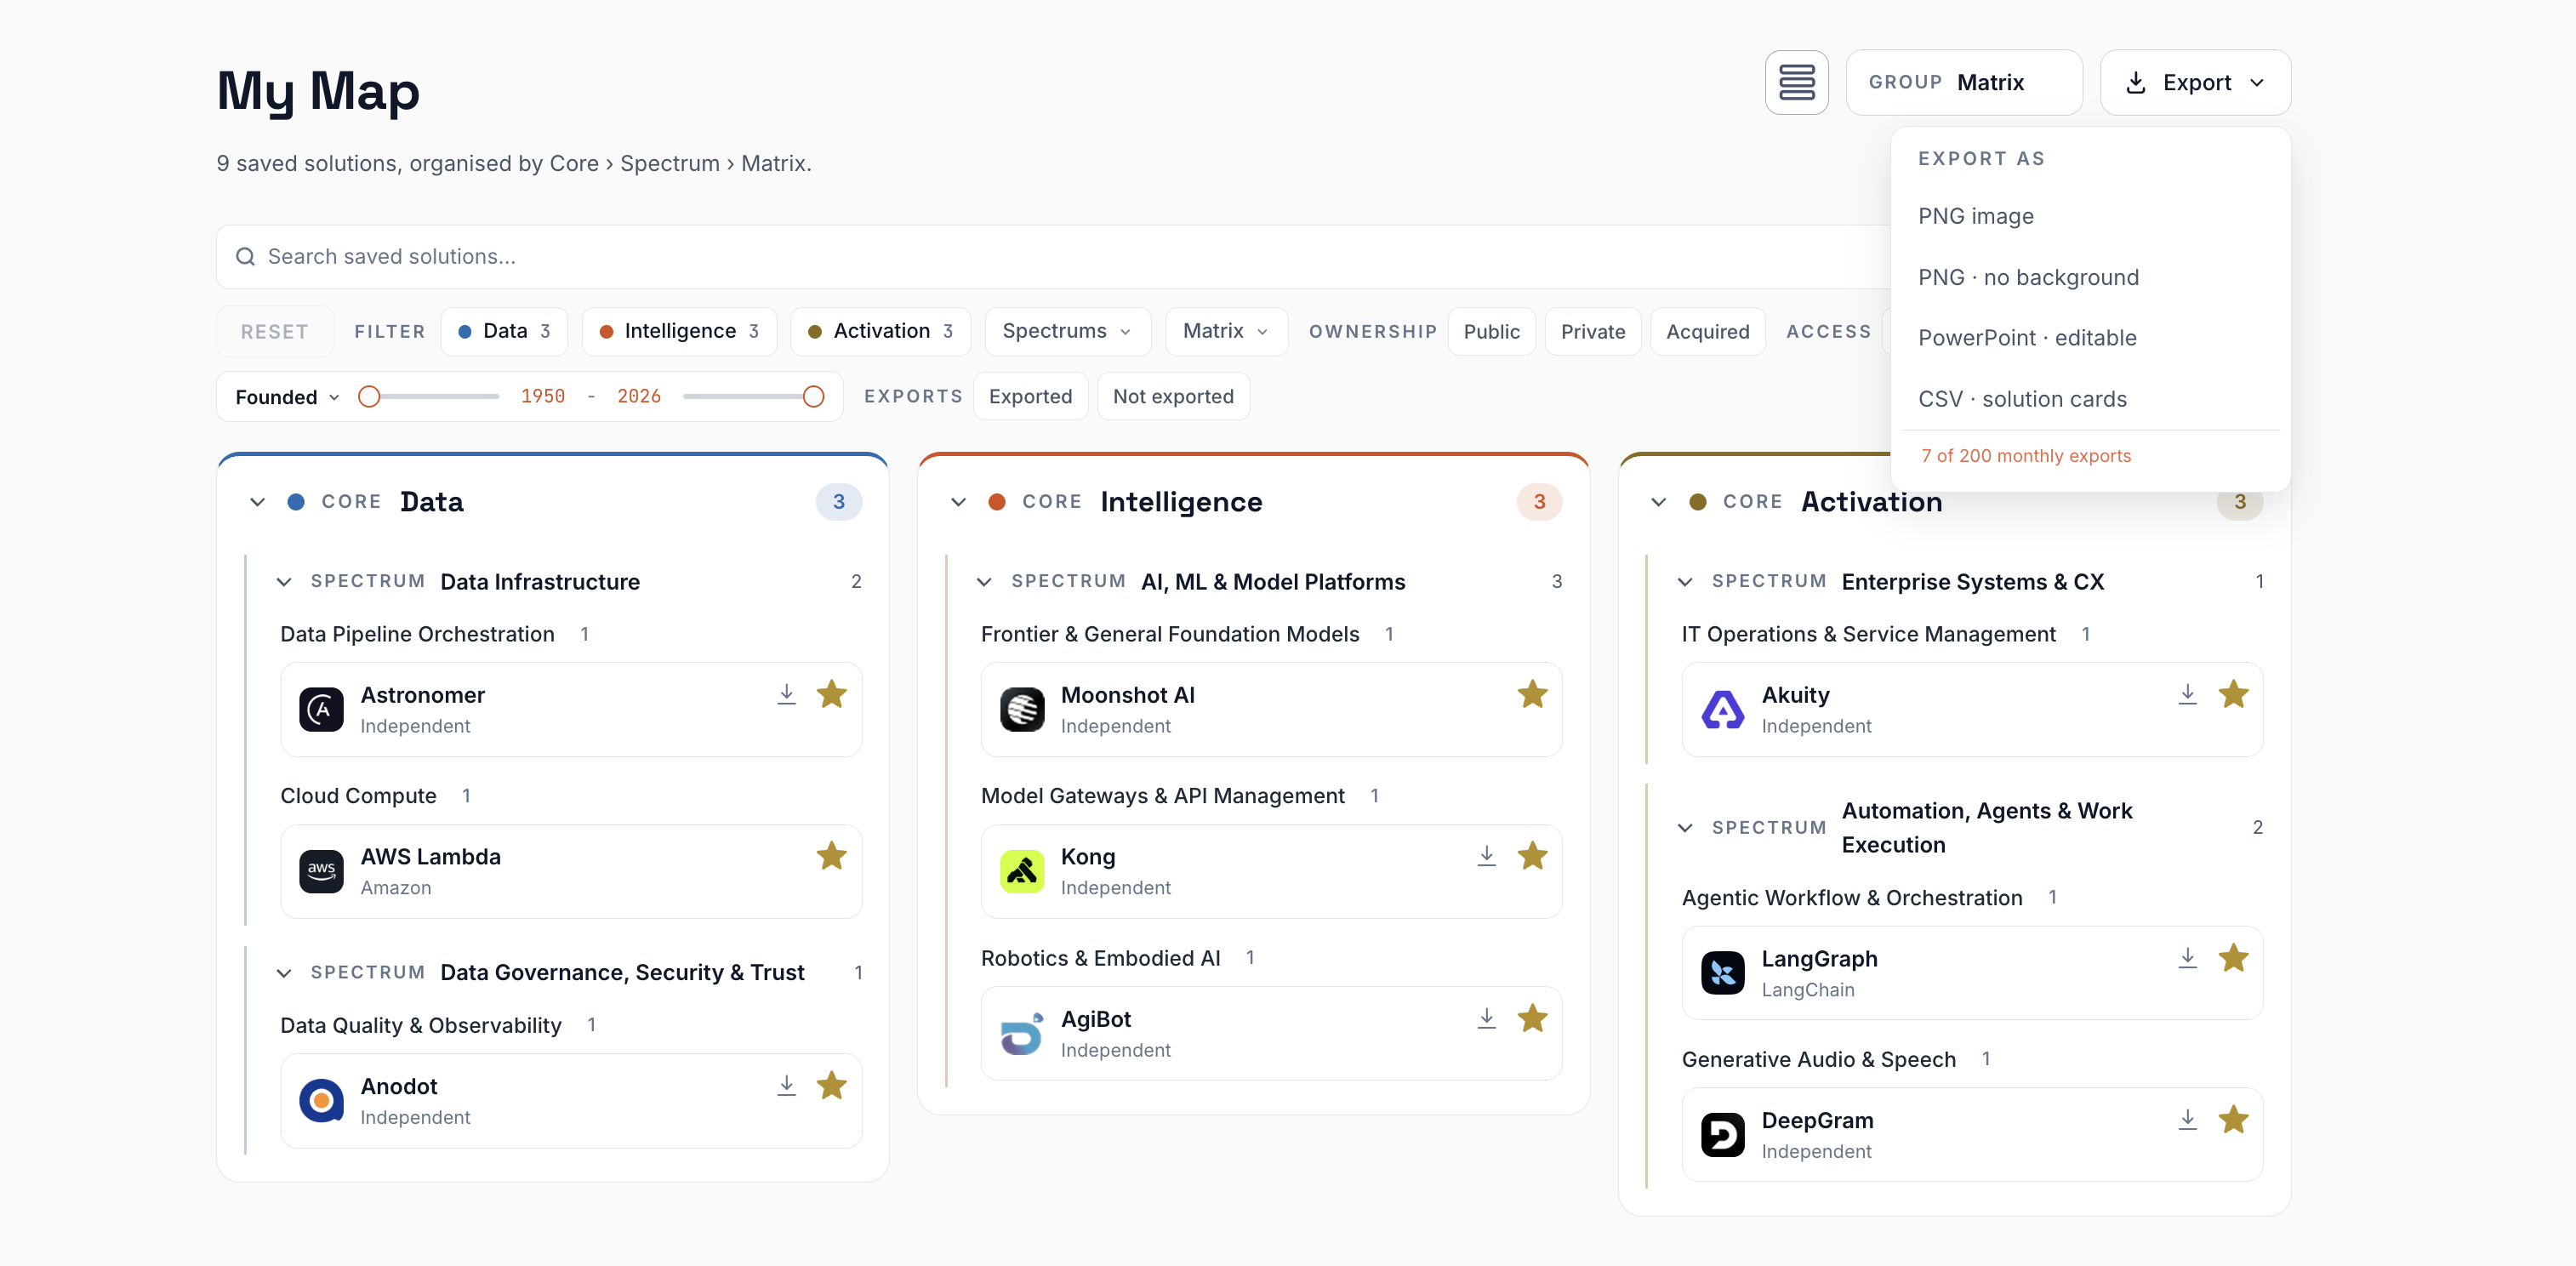
The Export menu on My Map turns your current board - exactly as filtered and grouped - into presentation-ready solution cards:
| Format | What you get |
|---|---|
| PNG image | The board as a picture, on a solid background. |
| PNG · no background | The same picture with a transparent background, ready to drop onto any slide. |
| PowerPoint · editable | A real .pptx where every card is a native, editable PowerPoint group - logo, name, organization, and chips are all live shapes, not a screenshot. |
| CSV · solution cards | One row per card with exactly the card's fields: your grouping columns, then Name, Parent Org, Ownership, Acquired, Paid, Open Source, Country. |
How the monthly allowance works
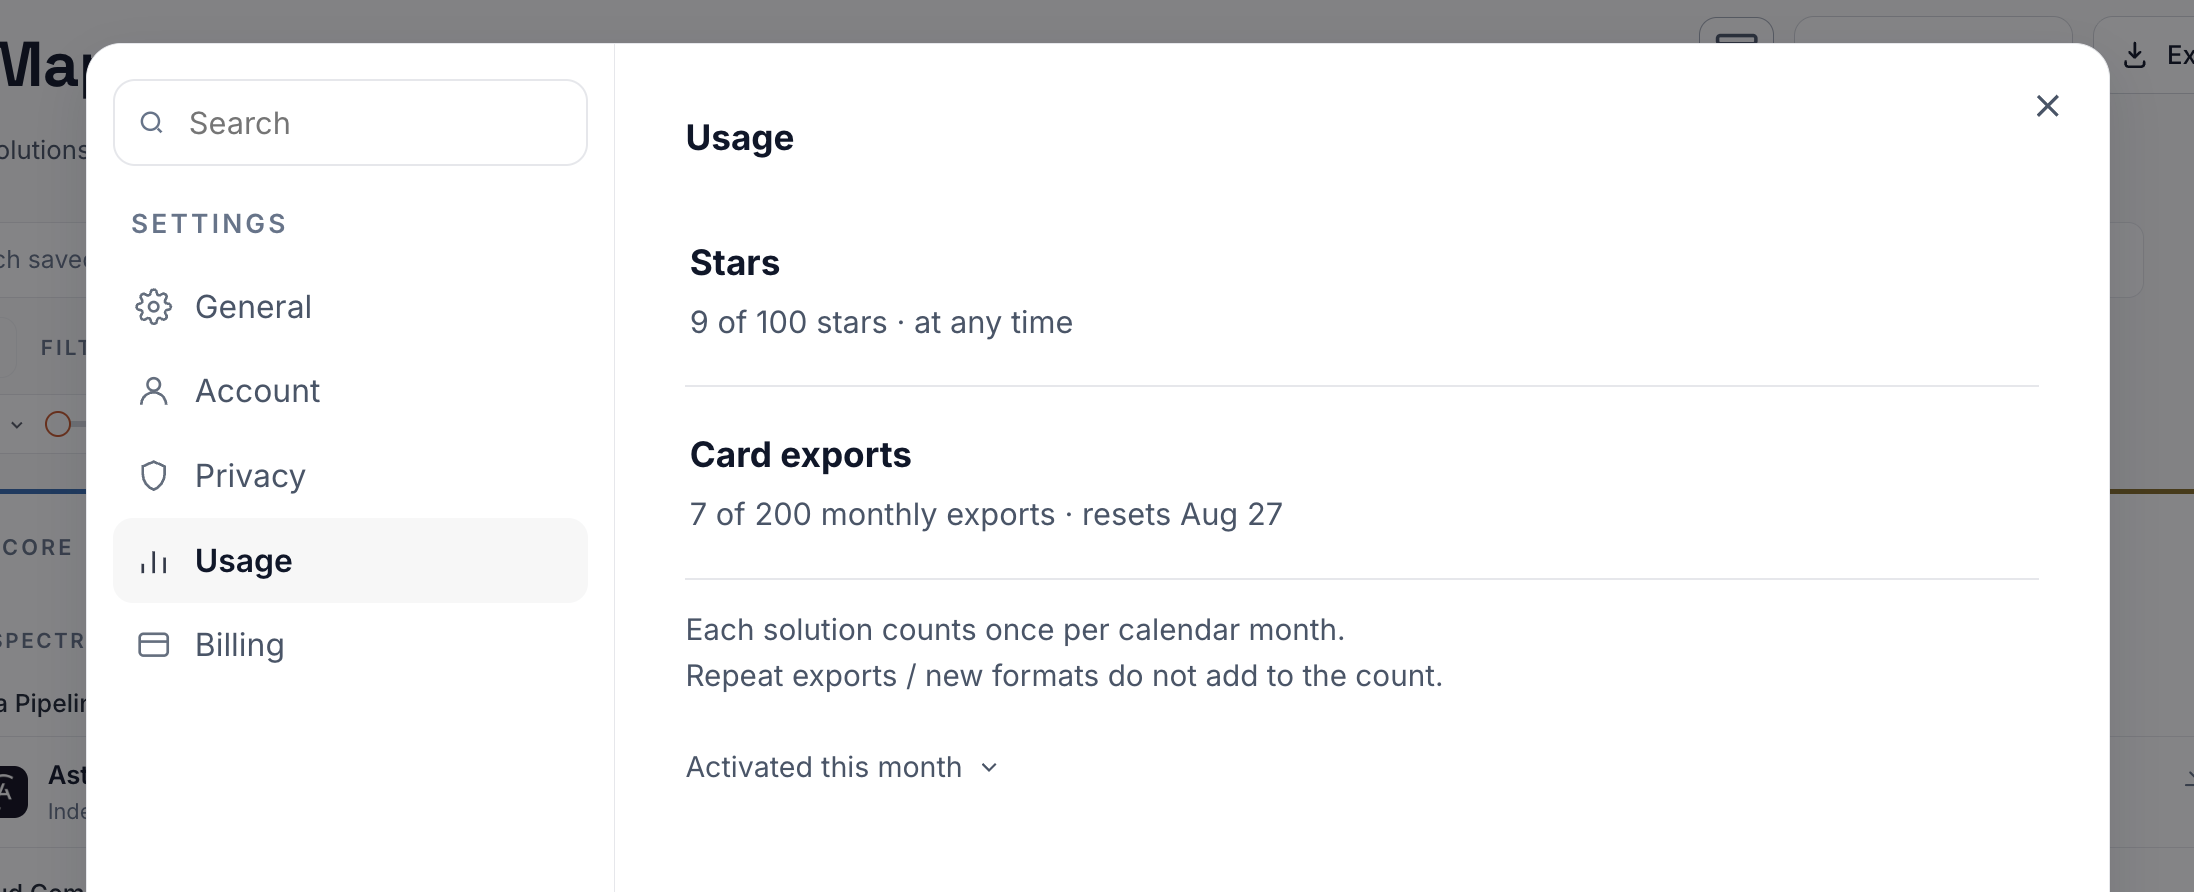
Card exports cover 200 distinct solutions per month, shared across all three formats. Only solutions new to the month count: each solution counts once, and re-exporting the same board - or the same solutions in a different format - adds nothing. The month follows your subscription cycle, and the exact reset date is shown with your tally in Settings › Usage.
- Before you export, hover a format row: a pill tells you whether this export is free (all solutions already counted) or how many new solutions it would add.
- If a board would go over, the menu says so and offers Show the N new, which applies the Not exported facet so you can see exactly which solutions would spend quota - narrow the board and export what fits.
- Already-exported solutions wear a small Exported mark beside their star for the rest of the month, and the Exports facet can isolate either group.
Data reference#
One row of the catalog is a solution: a single product or service, identified by a stable ID (like SL-000602), placed in exactly one matrix. This is every field the product shows, and where to find it.
Identity & placement
| Field | What it tells you | Where it appears |
|---|---|---|
| Name & logo | The product's name and favicon, drawn from its own domain. | Everywhere |
| Solution ID | The stable Nucleaus identifier, e.g. SL-000602. Profile URLs use it. | Profile, rail |
| Parent organization | The owning company, when the product is not independent. | Cards, rail, profile, CSV |
| Placement | The one matrix (and so spectrum and core) the solution competes in. | Breadcrumbs, Where this lives, all views |
| Website | The canonical product URL behind Visit website. | Rail, profile |
| Links | LinkedIn, X, and GitHub, where on record. | Profile header |
Company facts
| Field | What it tells you | Example |
|---|---|---|
| Description | A one-line summary on cards and the rail; the full description on the profile. | |
| Ownership | Public or Private. | Private |
| Acquired | Whether the company has been acquired, with the year and an acquisition note when recorded. | 2023 |
| Open source | Whether it has an open-source offering, with a note when recorded. | Yes |
| Paid | Whether it has a paid offering. | Yes |
| Release year | The year the solution came into the world. | 2019 |
| Location | Headquarters city, state, and country. | San Francisco, CA, United States |
| Total funding | Cumulative disclosed funding, in compact dollars. | $458.8M |
| Funding rounds | How many rounds the company has raised. | 12 |
| Funding summary | The latest round and its investors, when recorded. | Series B |
| Key individuals | The founding team, up to six names. |
Scores
Scored solutions carry four scores, each on a 1-10 scale with 0.1 precision:
| Score | What it gauges |
|---|---|
| Capability | The strength of what the product can do today. |
| GTM | Go-to-market strength - how effectively it reaches and wins the market. |
| Innovation | The pace and originality of where it is heading. |
| Overall | The headline score summarizing the three. |
Scores appear on the profile, the rail's mini scorecard, every scorecard chart, the Scores measures on ranked lists, and the score ranges on the filter slider. The profile adds the capability breakdown: the six capability areas that define the solution's matrix, each rated on a tier scale - Strong, Good, Moderate, Emerging, or None - so you can see where a solution is strong, not just how strong it is overall.
Limits#
Nucleaus Pro has exactly two usage limits. Both are visible at any time in Settings › Usage.
| Limit | Amount | Window | At the limit |
|---|---|---|---|
| Stars (My Map) | 100 solutions | At any time | New stars pause; remove any star and the slot frees immediately. Nothing you saved is touched. |
| Card exports | 200 distinct solutions | Per month, on your subscription cycle | Exports that would add new solutions pause until the reset date; re-exporting already-counted solutions stays free the whole month. |
- Distinct means distinct. Each solution counts once per month across all formats. Exporting one board as PNG, PowerPoint, and CSV costs the same as exporting it once.
- The month is your billing month. The export window resets on your subscription's renewal day, not on the first of the calendar month. The exact reset date is always shown next to your tally.
- Track both in Settings › Usage: your star count, your monthly export tally with its reset date, and an Activated this month list of the solutions exported so far, grouped by where they live.
Settings & billing#
The Profile icon at the top right opens the profile menu: Settings, Help, and Log out.
- Usage - your stars and card exports, live, with the export reset date and the Activated this month list.
- Billing - your plan, the renewal date, and your invoice history with downloadable invoices. Plan changes run through the secure billing portal and reflect here right away.
Sign in with Google or with your email and password - both reach the same account. Your theme choice and layout preferences (like the minimized ontology navigator) are remembered per browser. If your subscription lapses, the app returns you to the subscribe step; everything you saved is waiting when you come back.
Help opens the helper at the bottom left of every page - it is also reachable any time from its round launcher in that corner.
The Help panel#
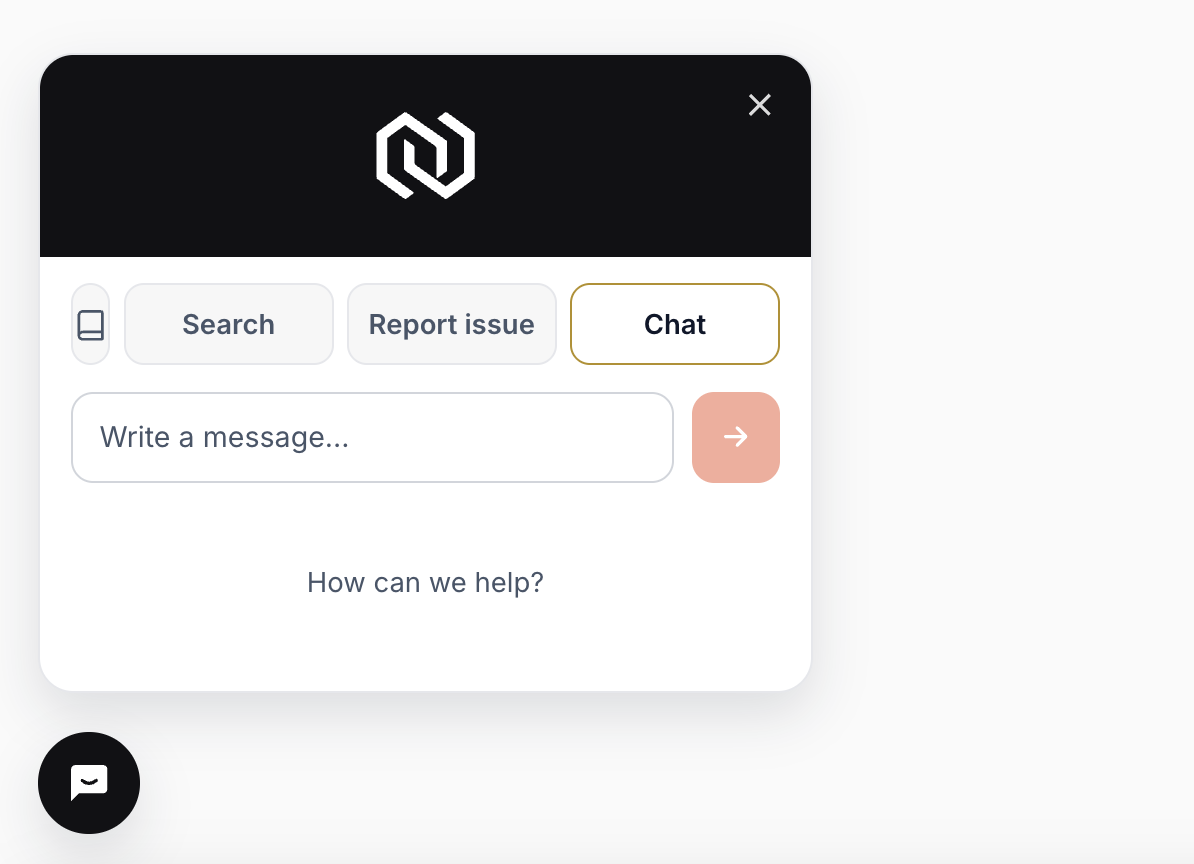
The chat launcher at the bottom left (also Help in the top right profile menu) opens the Help panel - it works beside the app, so the page stays live while you use it. Three tabs, plus a book icon that opens this documentation:
- Chat - support for using the product. Ask how to do something, find a page or a feature, or flag a snag; you get a short, helpful answer, and when a question needs a person, our team replies right in the same conversation. (For questions about the market itself, that is Nucleaus on Home, not here.)
- Search - one box over the docs and the whole catalog: sections, views, matrix, and solutions, each result a direct link.
- Report issue - describe the problem in your own words and pick a category.
Every report and every chat gets its own NS-##### reference, listed in the pill under the Nucleaus mark. Keep the number: typing it into the chat reopens that conversation anytime, even after it closes.
Still stuck?
Open Help to sign in and chat with us in the app.